[Live from Earth and Mars]

LFEM Index page Guest copyright Help Project Earth Earth Education Credits LFM Description Mars Pathfinder Resources Images

Mars Pathfinder
Meteorology Mast Temperatures

Mars Pathfinder and Viking atmospheric temperatures.         (Baseline data)

This applet was created specifically for the Live from Mars program by Ian Straub of NASA's RSPAC Learning Technologies Project (LTP).

Each frame of this animation contains a one sol plot of three atmospheric temperatures at heights of 0.25, 0.5 and 1.0 meters on the Mars Pathfinder Meteorology mast along with Viking temperatures. The Viking temperatures are measured 1.6 meters above the surface and averaged over 1/25 of a sol*. Mars and meteorological background information assist in interpreting these data.

Comments Meteorology, operations and science.
* sol= Martian day of 24.7 hours

Mars Pathfinder; Mission Summary Temperatures


Tabular Data: Pathfinder , Viking Index of Subsets of VL1, VL2 and Pathfinder
(Univ. Washington, Live from Earth and Mars)

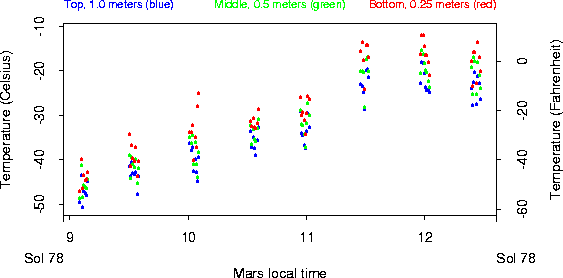
The above plot shows average temperature data from all three levels. The bottom, middle and top sensors are plotted in red, green and blue respectively. On sol* 1, July 4, 1997, the first four temperatures are warmer than Viking as the meteorology mast was still lying down immediately above the solar panel, which is warmed by the sun. The fifth sequence, at 14:00 Lander Local time, is relatively cooler as the meteorology boom has just deployed: sol 2 temperatures track Vikings temperatures more closely after the deployment. The length of time shown in this frame covers the entire Mars Pathfinder mission. The Viking Lander 1 data from the same season during the first year of VL1 operations, 1976, is shown in black. The VL1 sensor is 1.6 meters [63 inches] from the ground, which is about 0.6 meters, [23.6 inches], higher than Pathfinders top sensor. The Viking data for Pathfinder sols 8 thru 11 appear to contain spurious data.


(Univ. Washington, Live from Earth and Mars)

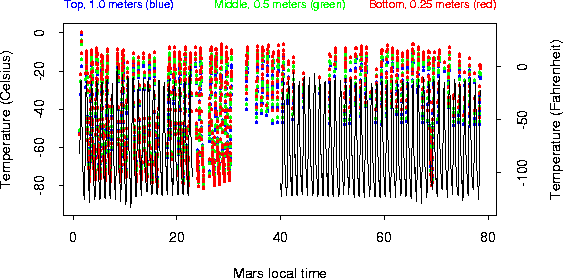
The above plot shows unaveraged periodic temperature data returned from Mars. The temperature data from all 3 sensors mounted on Pathfinders 1 meter mast are shown.


Martian meteorology and overview
 
Return to "Pathfinder" page for instrument details, Mars meteorology, and other information.
Data and calibration provided by:
Mars Pathfinder Program
NASA, Jet Propulsion Laboratory
4800 Oak Grove Drive
Pasadena, CA 91109
Dr. John T. Schofield
Developed by:
James E. Tillman, Research Prof.
and Neal C. Johnson
Department of Atmospheric Sciences, Box 351640
University of Washington
Seattle, WA 98195-1640

DEC
Support by Digital Equipment Corporation, providing DEC Alpha workstations, (a major computational resources), is gratefully acknowledged. These provided a key component in the Live from Mars component development and distribution nationwide.

Mars Pathfinder temperature data for both cruise and Operational Readiness Tests have been processed and plotted using the statistical software Splus, courtesy of Statistical Sciences, Inc. a division of MathSoft.
[Live from Earth & Mars]__________________________________________________

The Live 
From Mars Project