The Viking Mission to Mars
James E. Tillman
Viking Meteorology Science Team
and
Director, Viking Computer Facility
University of Washington
Seattle, Wash., 98195
Keynote Address
Prime Computer Users Group National Meeting
Orlando, Fla. 1984
1 Introduction
The planet Mars has often stimulated the imagination and curiosity of
mankind. With the following material, I hope to show some of the
intriguing aspects of the planet, as observed from Earth, aspects which
generated a strong desire to observe and explore the surface. These
Earthbound observers have long known that Mars has seasonal changes, with
dust storms and a varying polar cap. As its atmospheric and surface
conditions most resemble those of Earth, when compared to the other
planets in our solar system, the possibility of life and its relation to
terrestrial forms, provided a major portion of the scientific impetus for
the Viking Mission to Mars. The Viking Mission to Mars was the most
complex scientific exploration of any planet other than Earth conducted by
mankind. In the sophistication of the remotely operated instrumentation,
it surpasses even the Apollo Lunar Missions. Due to the exceptional
effort of its engineering, management, operations and scientific staffs,
it exceeded by far the design goals and expected lifetimes of the systems.
For example, Lander 1, the Thomas Mutch Memorial Station, ceased operation
after 2,245 sols ( 2,306 days ) on Mars, which should be compared with its
designed lifetime of approximately 120 sols. In the following segments,
some of the highlights of the Viking exploration of Mars will be
presented. Some of the interesting aspects of our use of Prime computers
for the Viking program will be discussed as well as our acquisition of
hardware for and development of the computer driven display, "The Viking
View of Mars" for the Smithsonian National Air and Space Museum. This
permanent exhibit presents text, graphics and images for the public and
should be on display during this meeting.
2 Mars
2.1 Observations of Mars from Earth
Several characteristics of Mars have contributed to our interest in it
since prehistoric times. It has a redish color, it is easy to observe,
its motions are not a simple circurlar orbit and, since the invention
of the telescope, it has been observed to undergo significant seasonal
changes. Seasonal changes of major interest are its development of
polar caps, the differences in its albedo, or contrast, on a day to day
and year to year basis, and the identification of linear features on
the surface as "canale", singular ( Father Secchi ), about 1869 and
"canali", plural ( Schiaparelli ) about 1877. Percival Lowell seems to
have pushed the linear features to the extermes of artistic endeavor
and speculation, in that in 1908 he published a book "Mars as the Abode
of Life" wherein he speculated that the canals were the work of
"intelligent creatures, alike to us in spirit, though not in form."
The possibility of life, but at a far more primitive level than that
envisioned by Lowell, was a major aspect of the Viking Mission.
Although we have not detected life on the planet, it has the
environmental characteristics most similar to Earth and consquently,
most likely of the other planets or moons to support life. However, as
meteorologists, our observations from the surface of Mars have provided
information, conclusions, new phenomena and speculations far beyond my
hopes or even dreams at the beginning of the mission.
Scintillation in the atmosphere due to temperature variations, limits
the resolution of Earth based astronomical observations such that
telescopes of a few inches diamater provide as high resolution as can
be simply obtained: larger telescopes are constructed to view dimmer
objects. However, Earth based observations are valuable in that we do
not currently have any active spacecraft at Mars and we have found
important year to year differences in ths climate of Mars. They
suppliment our Mariner and Viking observations by providing data on the
seasons in which dust storms form and some information as to their
extent and intensity. Since Mars is too far from earth for useful
observations most of the year, these data can not be very continuous,
even if the weather were always cooperative.
2.2 Pre Viking spacecraft observations
The first close observations of Mars by NASA spacecraft began with the
Mariner 4 flyby in 1965 which took 21 photographs. Each photo
contained 240,000 bits of data, transmitted to Earth at 8.33 bits per
second. Mariner 4 showed craters and a thin haze in the Carbon Dioxide
atmosphere. Two later Mariner flyby's in 1969, mainly revealed only a
cratered terrain without major geological features. However, the
observations of the Mariner 9 orbiter soon changed the perception of
Mars. During approach, a small dust storm in the southern hemisphere
developed into an intense global dust storm, injecting dust to heights
well above 30 kilometers. At the most intense period, only a small,
low contrast feature could be seen. Once the dust cleared, this
feature was revealed to be a volcano, Olympus Mons, whose top was 29
kilometers above mean Mars level! Other interesting features were the
chain of three other volcanoes almost as high as Olympus Mons and a
canyon system 5,000 kilometers long, up to 200 kilometers across and up
to 7 kilometers deep. Since the diamater of Mars is only 53% that of
earth, these large canyons and volcanoes seem even more dramatic. At
its base, the diamater of Olympus Mons is more than 500 kilometers. In
the next section, some of the highlights of the Viking Mission to Mars
will be covered.
3 The Viking Mission to Mars
The Viking Mission was the most ambitious planetary expolration program
undertaken by NASA or by any agency. In terms of its scientific goals and
complexity, it even surpassed the Apollo Lunar missions, although not in
cost or operational complexity. Its success was due to reasonable support
in the early and middle stages, to excellent management, and to the
dedication of its staff, contractors and vendors. There are numerous
instances in my own experience where I requested assistance from a vendor,
( Prime received many of these ), and tasks that normally took weeks were
somehow accomplished in hours or days. For example, during our upgrade
from a Prime 300 to 400 CPU, we were able to have a government ADP plan
approved within several weeks of submission.
3.1 Mission design
The initial mission design consisted of a 90 day nominal mission using
two identical spacecraft systems. Each spacecraft consisted of a
orbiter-lander pair, with the orbiter providing imaging of surface,
some science measurements, and high rate communications support for the
lander during the nominal mission operations phase. Operations were
planned around a nominal 90 day mission where one spacecraft would
reach Mars roughly a month prior to the other: both spacecraft would
operate simultaneously after tne landing. Early in the mission design
review process, reviewers from the Mercury, Gemini, Apollo and other
projects, favorably commented on the mission design but indicated it
would not be possible to operate both spacecraft with the staff and
facilities available, even though the mission operations staff was
roughly 1,000 full time individuals. A plan was developed to operate
the first Lander for approximately 45 sols, ( a sol is a Martian day of
24 hours and 37 minutes ) and then to reduce its activity to a minimum
while landing and operating the second lander for a similar period. In
this manner, the flight control teams were able to maintain reasonable
10 to 11 hour work days!
Launch was scheduled for the summer of 1975, followed by an 11 month
cruise to Mars. Landing was scheduled for July 4, 1976, summer in the
northern hemisphere and due to the low temperatures on Mars, the system
was not required to operate through the winter.
3.2 Early use of Prime in the Viking Mission
Since testing by the Viking Meteorology Instrument System, VMIS, was
inadequate due to the small wind tunnel constructed to simulate Martian
pressures and its CO2 atmosphere, we decided to perform additional
testing at NASA Langley Research Center during the summer of 1975. The
original plan was to replace the paper tape punch of the TRW VMIS test
set with a tape drive and use it for the tests. The proposal to
accomplish that and associated work was $200,000 and I proposed that we
develop a test set at UW which could both gather and reduce data in
real time. After preparation of a lengthy proposal and an extensive
evaluation, a Prime 300 was selected during the summer of 1974 to be
used for wind tunnel testing of the VMIS. Hardware interfaces to
simulate the lander computer were developed, software written and the
system checked out between its delivery in September 1974 and its
shippment to LRC in June of 1975. I chose RTOS as an operating system,
a mistake, since hindsight proved that DOS/VM, ( later Primos III ),
would have been a better choice due to our low data rates and its
greater software maturity.
The system had to function properly, and reliably, from the beginning
of testing as some flight qualified hardware was only made available
after launch and the NASA Transonics Dynamics Tunnel is generally
scheduled several years in advance. The TDT is 16 feet in diamater,
generates wind speeds from 10 MPH to transonic and can provide
pressures from 1% to 100 % of atmospheric. Another index of its
capabilities, is that it is powered by a 20,000 HP motor which draws
1,000,000 watts at our lowest testing speeds. During 1974, a specific
two week time slot was assigned to us at no cost, in this facility
whose testing cost was $4,000 per hour. The cost of the computer
system was less than 10% of the value of the test time. Initial
testing was begun in June 1975 in a facility especially designed for us
and was interrupted so that we could take part in the launch at Cape
Kennedy. After launch, the Flight Spare VMIS was made available for
testing and we moved to the TDT. Testing was successful, and as
expected, we had to upgrade our software while our instruments were on
the way to Mars. This was somewhat unusual, since all other software
were essentially in their final form for training exercises at JPL
between launch and Mars encounter. The system was moved back to UW in
November of 1975.
Once it was determined that our complex software would have to undergo
significant changes, we found that adequate time would not be available
on the JPL Univac 1108 systems ( an extra 1108 was installed for
Viking ) and we studied the possibility of providing support at UW on
the Prime for users at Martin Marietta, Denver, NCAR, Boulder, TRW,
Redondo Beach, JPL, Pasadena and UW. Since it was clear that the P300
would be overloaded, discussions were initiated with Prime as to
possible solutions. The architecture of the soon to be completed P400
was discussed with J. W. Poduska as well as its probable performance
and availability. A presentation was made to the Viking Project
management to purchase a 60 mbyte disk drive and the new CPU as soon as
it became available and to provide the software development facility at
UW. The proposal was accepted, and we began 24 hour/day operation in
November of 1975 which continues at the present with the exception of
one week for the installation of air conditioning. In April of 1976,
we received delivery of Serial # 2 of the P400 CPU's.
3.3 Mission operations during the Primary Mission
Mission Operations at JPL became intensive after launch of the
spacecraft. In the normal course of events, the VMIS system would not
be operated more than a few times during cruise to check its basic
functionality and we would have mainly been involved in training for
Mission Operations. However, drift was detected in the Lander 2
temperature system and the system was activated a number of times to
determine the magnitude and nature of the drift. Although the cause of
the drift was not discovered, we developed corrections for the early
mission measurements.
In June of 1976, we shipped the system to JPL for Mission Operations.
It arrived at 8 A.M. and with the assistance of movers, we installed
it and were operational by noon. The system was mainly used for
science analysis, using a version of our Mission Operations meteorology
software. This Mission Operations software was configured to produce a
meteorology tape, after some preliminary processing, for use on Prime,
prior to the more extensive data reduction segment of the program.
When the first data were relayed from the lander tape recorder, we
obtained this tape and produced the first meteorology data from the
surface of another planet, Mars, on our system. Since it was summer in
the tropics at our landing site, the wind was light and variable, much
the same as on earth under similar conditions.
The project director was James Martin of NASA Langley Research Center
and the success of the mission was due in a large part to the
competence and dedication of Jim and his staff. A number of possible
landing sites had been selected prior to Mars encounter on the basis of
the previous Mariner 9 mapping and Earth radar data. It was the
function of the site selection group to choose an acceptable and safe
site from the previously selected sites. At least a week in orbit
around Mars was planned for this activity and it was desired to land on
July 4, 1976, the bicentennial. However, engineering prudence
sometimes delays plans and desired timelines. The Viking orbiters were
capable of resolving objects larger than about 40 meters and, in the
ideal case, one would use observations of roughness elements larger
than this and extrapolation to estimate the chance of spacecraft
disturbing boulders. However, all cases are not ideal and earth based
radar data was required to supplimented the orbiter images. Although
the radar can not measure individual small features, they can estimate
the size distribution of boulders, etc in large areas which are smaller
than can be resolved in the images. The combined data indicated that
the previously chosen sites were not safe and the Fourth of July passed
as the search went on. The search could not go on indefinitely due to
due to the cost of maintaining 1,000 of us at Mission Operations and
due to the fact that the second spacrcraft was rapidly approaching and
would have to occupy the resources of the flight operational staff.
Another site was selected on the basis of radar and orbiter data and
landing was initiated. Due to the one way propigation time of 18
minutes from Mars to Earth, the landing sequence had to be automated.
The entry and landing procedure consists of three phases. First, the
lander separates from the orbiter and retro rockets cause it to enter
the atmosphere, protected by its heat shield. At about 6,400 meters,
the heat shield is jettisoned and the parachute is deployed. Finally
at about 1,200 meters, the parachute is jettisoned and the retro
rockets are ignited with the descent being under control of the
lander's Guidance and Sequencing Computer, GCSC, radar altimeter and
inertial reference unit. The first landing was completely successful,
wittnessed by many thousands of staff and families at JPL and by
millions throught the world.
The second landing proceeded 44 sols later with fewer problems in the
site selection process. Although Lander 1 was to be placed in a low
activity mode for Lander 2's arrival, we managed to schedule continuous
meteorological data collection from both landers. To have both landers
and orbiters functioning successfully, was the result of good design,
management and planning. This is not to imply that there were not a
few "cliff hangers" such as the Biology Instrument and the GCSC's
plated wire memory, but the final results were more than satisfactory.
At the end of nominal mission operations, the Prime system was moved
back to UW in November of 1976.
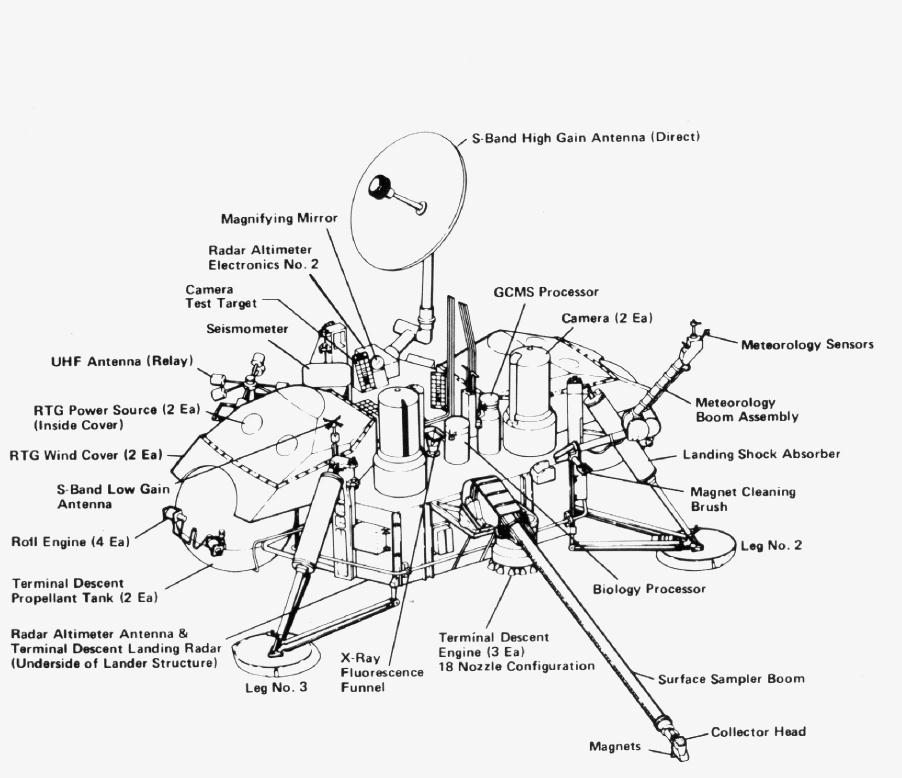
3.4 Science
An idea of the complexity of the scientific instrumentation can be
gained by considering the experiments. The major individual ones are:
1) three biology experiements,
2) organic analysis,
3) a gas chromatograph-mass spectrometer serving both organic and
atmospheric analysis,
4) stereo black and white and color fascimilie imaging system
5) seismology
6) meteorology
7) other supporting components and experiemnts such as the soil sampler
arm used to feed the experiments and to determine soil properties. To
appreciate the stringent engineering requirements, one should also be
aware that the complete lander operated on an average power of 50 watts
and had to be sterilized at 130 degrees Celsius for two 24 hour
periods. These simultaneous requirements, mandated innovative and
careful design as well as somewhat higher than normal development and
component cost. Another indication of the success is that the
proceedings from only two of the special Viking conferences weigh 8
pounds and contain 1368 pages: this is only a small portion of the
Viking generated research publications.
As to specific results, the consensus is that no evidence for life was
found even though the biology experiments reacted in a strongly
positive way. The reason for the reaction is that the Martian sols
contain compounds that liberate oxygen in the presence of water.
The atmosphere is composed of 95% CO2, small amounts of nitrogen and
oxygen, as well as traces of Argon, hydrogen and other gases. In the
field of meteorology, we found that fronts on Mars were more similar to
those on Earth than we expected. However, in one instance at Lander 2,
( Lander 1 was at 22 degrees north while Lander 2 was at 48 degrees
north ) six or seven fronts passed by at almost identical time
intervals and strengths, as measured from the pressure data: on earth,
we rarely see such regularity. Since we were able to continue
operation for more than three Martian years, we were able to observe
year to year similarities in many meteorological phenomena as well as
differences. Major atmospheric, and over long time scales, geological,
process are the global dust storms which decrease the daily average
temperature on the order of 14 degrees Celsius or approximately 25
degrees Farenheight. As the dust remains in the atmosphere for many
tens of sols, the effect is similar to that discussed in Nuclear
_______
Winter: Global Consequences of Multiple Nuclear Explosions, R.P.
_______________________________________________________________________
Turco, O.B. Toon, T.P. Ackerman, J.B. Pollack and Carl Sagan,
_______________________________________________________________________
Science, 23 dec. 1983, pp 1283-1292.
_____________________________________
An interesting, and as yet unexplained characteristic of the dust
storms, is that some years have major storms while others do not. For
example, Year 1 had two, years two and three had none and the beginning
of year four had one. We do not know about the rest of year four due
to the landers' failure during this fourth year storm, the most intense
observed from the surface of Mars. Another unusual feature is the
discovery of transient dust storms, which seem to repeat at the same
time of year, and which indicate a mode of global oscillation in the
atmosphere of Mars.
Many other interesting, and important, atmospheric processes have been
studied on Mars. One is the year to year similarity in the formation
and sublimation of Mar's polar caps. Mars has an inclined axis of
rotation of 25 degrees celsius, similar to Earths, which produces a
large annual temperature range. Due to its low temperatures and carbon
dioxide atmosphere, around 20% of the atmosphere condenses, in the form
of "dry ice" each year with surprisingly precise repeatability each
year despite the variation in dust storm intensity and number from year
to year. A difference is the erosion of soil from year to year.
During the third year, between sols 1720 and 1756, ( there are 669 sols
per Martian year ) piles of dust placed by the soil sampler moved as
well as small pebbles. These were probably accompanied by local dust
storms but why did they not move in previous years and why was there no
global dust storm this year? We hope that analysis of the data that we
presently have will provide some insight into these questions in
addition to nomerical modelling of the processes.
Martian meteorology is important, as well as interesting, in that its
atmosphere resembles that of Earth more closely than any of the other
planets, or moons, in our solar system which have atmospheres. By
testing our physical and numeric models of atmospheric motion, climate,
etc. on Martian observations as well as terrestrial ones, we can
refine them to better explain and predict the effects of changes or
differences in the variable parameters. For example, the effect of
major amounts of dust on the atmosphere are sometimes easier to
understand Mars, than on Earth, since it swamps the other
meteorological variables at times. However, there are no funds if FY85
for Mars Data analysis!
4 Real time operations at the Viking Computer Facility
One of the main problems with the Viking Mission was its success! Prior
to landing, I suspect that most of us would readily have traded the chance
of a multi-year mission for a guranteed 90 day mission without hesitation.
It the end of the nominal mission we were faced with four healthy
spacecraft and an excellent flight operations team. During the next year
or so, we at UW were content to continue receiving data from JPL in
processed science form even though we had operational software to obtain
meteorology data from the meteorology Front End Processor, FEP, tapes
produced by the JPL UNIVAC 1108 system. However, if we were to be able to
obtain meteorology data in the future, it was clear that we would have to
implement some of the operational software which handled the raw
spacecraft data stream from the Deep Space Network, DSN, since the filght
operations IBM 360/75's were certain to be decommissioned soon. A minimal
set of this software was implemented on the VCF's Prime for use in
obtaining meteorology results from the meteorology science data format in
the raw data stream and pressure from the engineering data format. While
implementing this capability, changes were made in the data format and
block lengths by NASA, which we included as options. In Janurary of 1981,
we began processing data on a weekly basis, including a comprehensive set
of engineering parameters for the operations team at JPL. Data were
provided to JPL by dial up access or by mail. In the next few months, we
expanded the engineering processing, including plotting selected, and then
all, engineering parameters. Prior to our conversion of the software,
data were plotted by hand at JPL if at all.
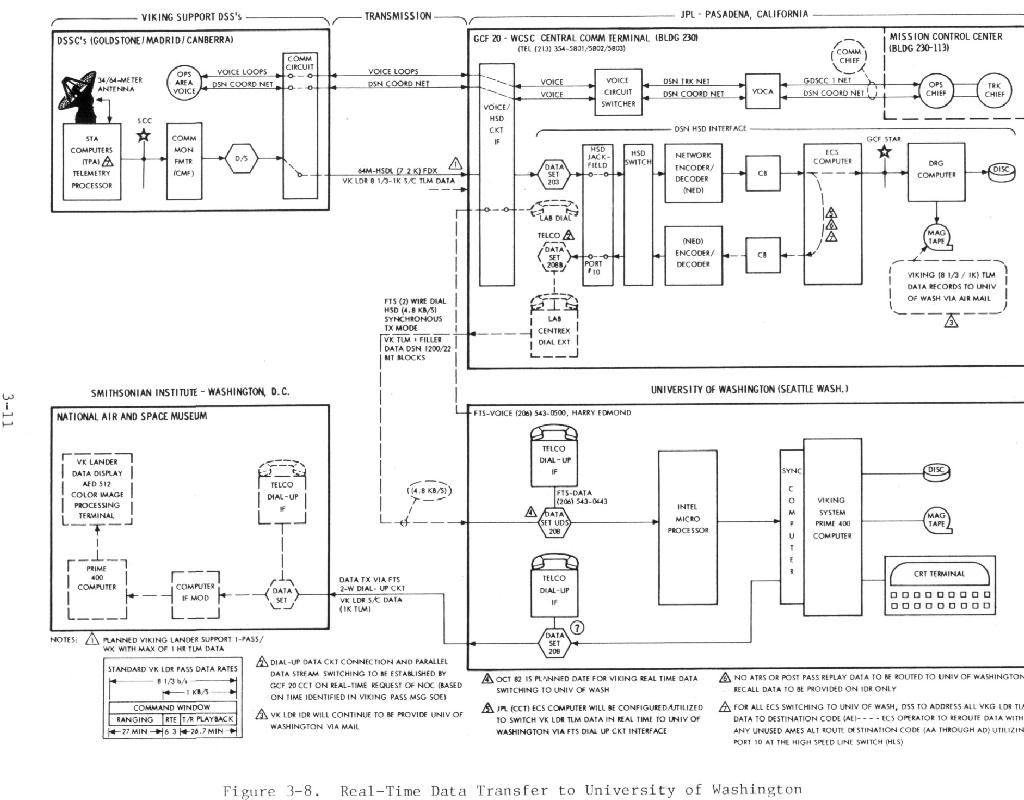
Around that time, it became clear that the lander might continue to
function for many years and dedicated, part time, Viking staff members
initiated a program to recondition the two dead nickel-cadmium batteries
of the four on Lander 1. To assist in the rapid turnaround required for
this effort to be successful, I proposed that we implement a direct, real
time link between JPL and the VCF since the previous method was to mail
tapes from JPL to UW. This was acepted and after several iterations, the
communications configuration of Figure 3-8, Telecommunications and Data
____________________________
Acquisition System Support for the Viking 1975 Mission to Mars, The Viking
_________________________________________________________________________
Lander Monitor Mission May 1980 to March 1983, D. G. Mudgway, JPL
_________________________________________________________________________
publication 82-107 was implemented. The synchronous NASA communications
__________________
codes were decoded and input to an AMLC port on the VCF using an Intel
system. First testing of the system was accomplished on May 14, 1982 and
our permanent installation was implemented in October of 1982. The only
special provisions made on the Prime end were to increase the size of the
AMLC buffer to around 1,000 bytes to preclude the possibility of buffer
overflow. Since the data rate from Mars to Earth was 1,000 bits/sec,
there was no need to assign a high priority to this task. With our real
time capability, we were able to provide immediate analysis of the battery
conditioning results for planning the following sequences in a timely
manner.
5 Development of the Smithsonian National Air and Space Exhibit
Prior to the establishment of the real time link, we had been displaying
lander images on our AED 512 image processor. Once the plainning for the
link was initiated, Dr Farouk El-Baz of the Smithsonian National Air and
Space Museum was consulted as to whether the Museum would like to have a
weekly picture "Live from Mars", provided we could obtain the donation of
an image processor. After a comittment of AED to donate an image
processor I requested that Prime donate a used system for the Museum.
After long negotiatious with the varions parties, and Stan Kent of the
Viking Fund providing maintenance funds, a system was donated including
two Prime microcoded MPC 4 controllers, to allow high speed DMA
communications between Prime and the image processor.
Microcode for the MPC 4 was written by Noel Cheney of the Atmospheric
Sciences Department at UW, while we continued to operate 24 hours/day. To
minimize impact to users and disruption of our continuous weather data
collection and processing, initially the testing of MPC 4 microcode was
done between 7 and 8:30 AM. To make the development of this code opssible
under such constraints, Dr. Harold Edmon of the VCF wrote a debugger for
microcode development as well as a routine to download microcode without
cold or warm starting the system. User interfaces for the MPC 4 and image
processing software were written by James Synge of the VCF. William Guest
processed and generated the meteorology graphics that are included in the
display and Neal Johnson provided in Viking data processing. The sequence
of text, graphics and images that are presented at the Museum, were
developed by Dr. Ted Maxwell of the museum, and myself and I designed the
overall system as well as convincing the interested parties to donate the
required resources.
Subsequent to our development of the display, which requires only a
special cable and our microcode to drive the AED, we have developed an
expansion capability which permitts multiple AED's to be driven by one
port with a small interface box, which supports up to three local image
processors and provides line drivers to another similar interface. The
next interface can be located thouands of feet away and in turn can
support several image processors. While this does violate our "commercial
hardware only" policy it does allow high speed and significant flexibility
with minimal additional hardware. I hope that such features will be
provided as off the shelf items in the near furure by Prime or others.
Unfortunately, schedules and other complications delayed the opening of
the exhibit until after our loss of the lander. However, during one of
our routine real time downlinks from Mars, we processed and transmitted
the weekly image to the Smithsonian system via Primenet within an hour of
receipt of the data by our facility as a simple demonstration which
required no software changes on our part. Primenet was routinely used
between NASM and UW during our joint development and debugging of the
display.
While the loss of the "Live from Mars" aspect, lessens
the excitement, the display was never planned to include more than a
small amount of the latest data, due to the once a week transmission.
Also, the fact that the data are transmitted at Mars noon coupled with
the 37 minute difference in day length, gurantee that the majority of
the downlinks would not have been live during public hours. I would
reccommend that you take advantage of the opportunity to view the
exhibit, at the Museum due to the other historical items associated
with the display and during this meeting. In the Smithsonian, it is a
permanent exhibit buried upstairs in the "Exploring the Planets"
gallery, which requires dilligence to find.
 The Viking Mission to Mars was the most sophisticated and interesting
planetary missions ever executed. The enclosed table summarizes some of
the operational parameters and it should be remembered that the landers
both lasted through winters with temperaures of -118 degrees Celsius and
Lander 1, the Thomas Mutch Memorial Station, lasted 2,245 sols, roughly 20
times its design life. Such performance is a proper tribute to the
spacecraft designers and operators, as well as the Project management! As
a follow on, I suggest that we begin planning for a manned mission to
Mars, inviting and encouraging all nations to take part.
The Viking Mission to Mars was the most sophisticated and interesting
planetary missions ever executed. The enclosed table summarizes some of
the operational parameters and it should be remembered that the landers
both lasted through winters with temperaures of -118 degrees Celsius and
Lander 1, the Thomas Mutch Memorial Station, lasted 2,245 sols, roughly 20
times its design life. Such performance is a proper tribute to the
spacecraft designers and operators, as well as the Project management! As
a follow on, I suggest that we begin planning for a manned mission to
Mars, inviting and encouraging all nations to take part.
Figure 1
Viking Lander "As Built" Performance Capabilities. NAS1-9000, June 1976.
Martin Marietta Corp., Denver Division, Denvery, CO 80201
Figure 2
Mission Operations Communications including Real Time.
NASA Deep Space Network >> Jet Propulsion Laboratory >>
University of Washington >> Smithsonian National Air & Space Museum,
Washington DC.
From "Telecommunications and Data Acquisition System Support for the
Viking 1975 Mission to Mars, The Viking Lander Monitor Mission
May 1980 to March 1983", D. G. Mudgway, JPL publication 82-107.
______________________________________________________________________
______________________________________________________________________
Parameter V0-1 V0-2
______________________________________________________________________
Number of days from launch to end of mission 1813.98 1049.52
Number of orbits of Mars 1488.0 706.1
Number of pictures recorded in orbit 36,622 16,041
BILLION data bits played back from 357.7 161.3
the tape recorders (including lander relay data)
Tape travel across recorder heads, km 2955 1397
Number of commands sent by the Network 269,500
Number of tracking passes supported by the Network 7,380
Hours of tracking time provided by the Network, 56,500
_________________________________
Table 1.
General Viking Orbiter Statistics
______________________________________________________________________
______________________________________________________________________
______________________________________________________________________
______________________________________________________________________
Event Viking 1 Viking 2
______________________________________________________________________
Launch Aug. 20, 1975 Sept. 9, 1975
Arrival June 19, 1976 Aug. 7, 1976
Landing July 20, 1976 Sept. 3, 1976
Site Chryse Planitia Utopia Planitia
Coordinates 22.3 N, 48.0 47.7 N, 225.8
Orbiter in orbit 1,509.9 days 718.8 days
Lander active
on surface 2,245 days 1,316.1 days
End lander operations Nov. 13, 1982 April 11, 1980
End orbiter operations Aug. 7, 1980 July 25, 1978
Orbiter photos 51,539
Lander photos More than 4,500
Photo coverage 97% of planet with resolution of 300 m
(1,000 ft) or better.
25% of planet with resolution of 25 m
(82 ft) or better.
Lander weather reports: more than 1 million
Orbiter infrared observations: more than 1 million
Orbiter weight: 2,325 kg
Lander weight: 571 kg
Orbiters built by Jet Propulsion Laboratory
Lander built by Martin Marietta Aerospace
Project managed by NASA Langley Research Center
____________________
TABLE 2
______________________________________________________________________
______________________________________________________________________
J. Tillman: