![[Live from Earth and Mars]](../../graphics/mars_map.gif)

Surface Material Maps of
Viking Landing Sites on Mars
NASA TM 4210, 1990
Dr. Henry John Moore, Scientist Emeritus,
Astrogeology Team, MS 975,
U.S. Geological Survey, Menlo Park, CA, 94025,
J. M. Keller, Stanford University, Stanford CA, 94309.
We have mapped the surface materials at the Viking landing sites because a review of the literature reveals that such maps have not been made and better information on the types of materials-and their abundances should lead to a better understanding of the geology and remote-sensing signatures of the sites. The maps extend to 9 m in front of each lander and are about 15 m wide -- an area comparable to the area of a pixel in the highest resolution Viking Orbiter images of the Lander 1 site. Figure 1 shows our map of the Lander 2 site.
The maps are divided into near and far fields (Fig. 1). Data for the near fields are from: l/10-scale maps [l], unpublished maps, and lander images. Data for the far fields are from: l/20-scale contour maps [2], lander camera mosaics with overlain contours [2], and lander images. Rocks were located on these maps using stereometric measurements and the contour maps. Rocks form the control for delineation of other surface materials.
Map units are: (1) fine, (2) soillike, and (3) rock materials. Coordinates, length (1), width (w), and height (h) for each rock are recorded in a file for computational purposes. For many rocks, 1 or w was estimated. The rocks are assumed to be ellipsoids. Size-frequency and area-covered distributions of rocks are derived from the file according to the surrounding map unit, field, and size. All rocks mapped within fine material and all rocks >0.25 m in the near and far fields are included in the distributions, but rocks <0.25 m in the far fields are assumed to have the same distribution as rocks <0.25 m in the near fields. Areas covered by fine materials and rocks and soillike materials and rocks are measured on the maps. Areas covered by fine and soillike materials are obtained by subtraction of the area covered by rocks.
The forms of our size-frequency distributions of rocks are similar to previous ones [1,3]. Frequencies of rocks > O.18 m are larger at Lander 2 than Lander 1, but the reverse is true for smaller rocks. Fractions of area covered by the larger rocks in logarithmic size-bins are irregular and yield no simple relations for extrapolations to larger sizes of rocks, but the areas covered by small rocks diminish rapidly with decreasing size. Our fractions of area covered by centimeter- size and larger objects and rocks are about 11.5% at Lander 1 and about 16% at Lander 2. Outcrops of rock cover an additional 4.5% of the area at the Lander 1 site. At Lander 1, about 18% of the surface is covered by thick deposits of fines and 40% by both thick and thin fines. At Lander 2, about 30% of the surface is covered with fine material.
Although there are questions about the physical properties of the materials mapped beyond the sample fields, we assume that the fine materials are loose fine-grained powders with a small thermal inertia like that previously assumed for drift material [4]- If this assumption is correct, our results suggest that the thermal inertias of crusty to cloddy and blocky materials [l] may be larger than previously estimated [4] and that the amounts of S03 plus chlorine in the soillike materials [5] are directly proportional to their thermal inertias. These differences do not substantially alter the previous conclusions of Moore and Jakosky [4].
Preliminary analyses of our data suggest that polarized- and depolarized-radar-echo cross sections and normal radar reflectivities for the Lander 1 site should be about the same at 3.5- and 12.5-cm wavelengths. For Lander 2, polarized- and depolarized-echo cross sections are smaller and the quasi- specular cross section is larger at 3.5-cm wavelength than at 12.5-cm wavelength. These relations are chiefly related to the areal distributions of rocks and the model used to calculate the radar cross sections [5,6]. For Lander 2, the fraction of area covered by "wavelength-size" rocks, or diffuse scatterers, is smaller for the 3.5-cm wavelength than the 12.5-cm wavelength; for Lander 1, these areas are about the same for both wavelengths. For Lander 2, the fraction of area of large rocks contributing to the quasi-specular echo is greater at the 3.5-cm wavelength than at the 12.5-cm wavelength; for Lander 1 these areas are about the same at both wavelengths. Finally, the three types of surface materials and "wavelength-size" rocks contribute to the bulk quasi-specular radar echoes in complicated ways.
REFERENCES [1] Moore, H.J., et al., 1987, U.S. Geol. Prof. Paper 1389, 222p. [2] Liebes, S. Jr., 1982, NASA CR 3568, 290p. [3] Binder, A., et al., 1977, J. Geophys. Res., v. 82, p. 4439- 4451. [4] Moore H.J. and Jakosky, B.M., 1989, Icarus, v. 81 p. 164-184. [5] Evans, J.V. and Hagfors, T., 1964, Icarus, 3, p.l51-160. [6] Campbell, M.J. and Ulrichs, J., 1969, J.Geophys. Res., v. 74, p. 5867-5881.
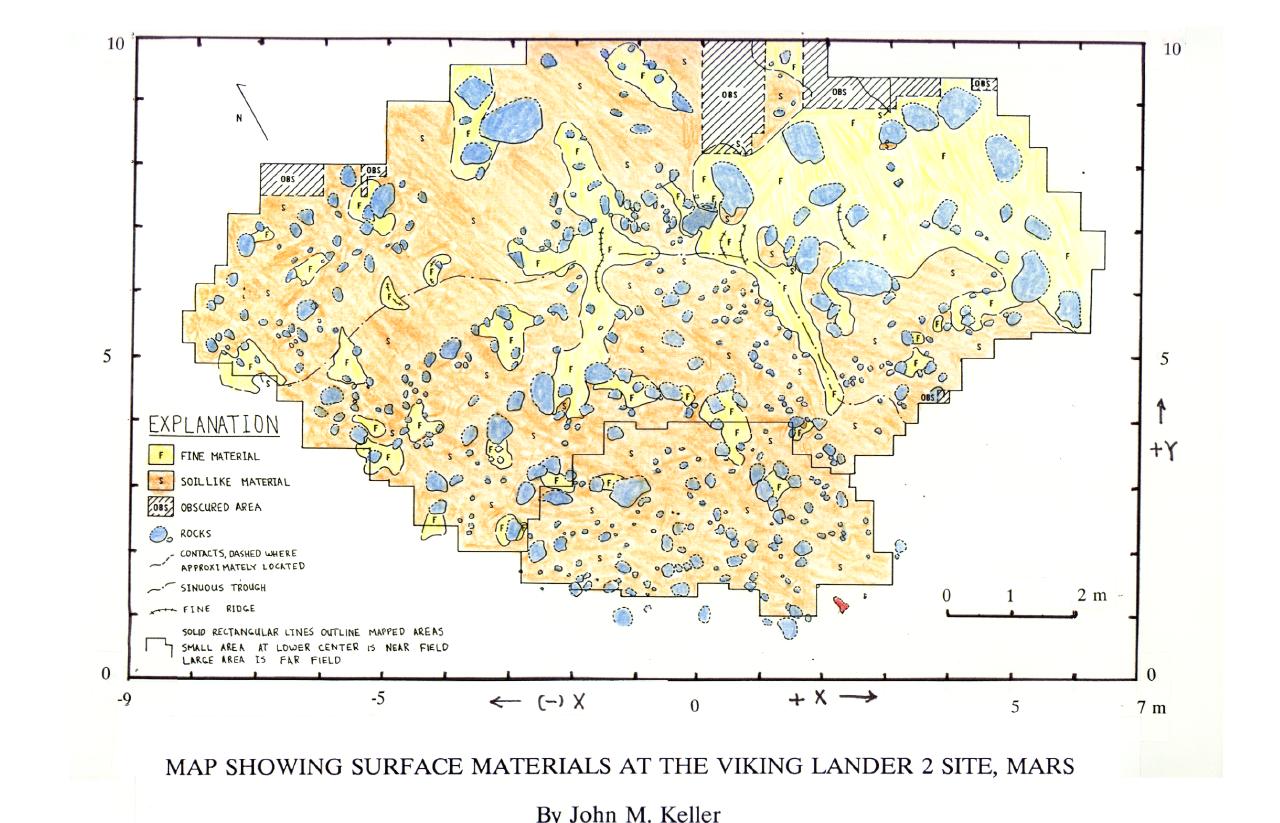
Surface-material map at Viking 2 site.
(Click on image to obtain full size Map )
Mapped area is divided into a near field (A) and a far field (B). The population of rocks <0.25 m within the soillike areas of the far field were assumed to be the same as those in the near field. Fine ridges are crests of ripple-like bedforms; sinuous trough may partly outline ice polygon. Coordinates are in meters from center of Lander 2 (0,0). Note that mapped area is about 9 by 15 m. (167798 Bytes)
![]()
![]()
![]()
-
Prepared by:
James E Tillman,
George F LeCompte,
from ideas and text of Moore.