![[Live from Earth and Mars]](http://www-k12.atmos.washington.edu/k12/graphics/xmars_map.gif.pagespeed.ic.Bwqa4QZhmw.png)

Surface Material Maps of
Viking Landing Sites on Mars
NASA TM 4300, 1991
Dr. Henry John Moore, Scientist Emeritus,
Astrogeology Team, MS 975,
U.S. Geological Survey, Menlo Park, CA, 94025,
J. M. Keller, Stanford University, Stanford CA, 94309.
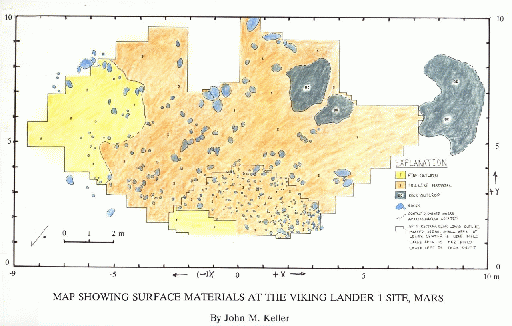
We have mapped the surface materials at the Viking landing sites [l] to gain a better understanding of the materials and rock populations at the sites and to provide information for the future exploration. The maps extend to 9 m in front of each lander and are about 15 m wide -- an area comparable to the area of a pixel in high resolution Viking Orbiter images.
The maps are divided into near and far fields (Fig. 1). Data for the near fields are from: 1/10-scale maps [2], unpublished maps, and lander images. Data for the far fields are from: l/20-scale contour maps [3], contoured lander camera mosaics [3], and lander images. Rocks were located on these maps using stereometric measurements and the contour maps.
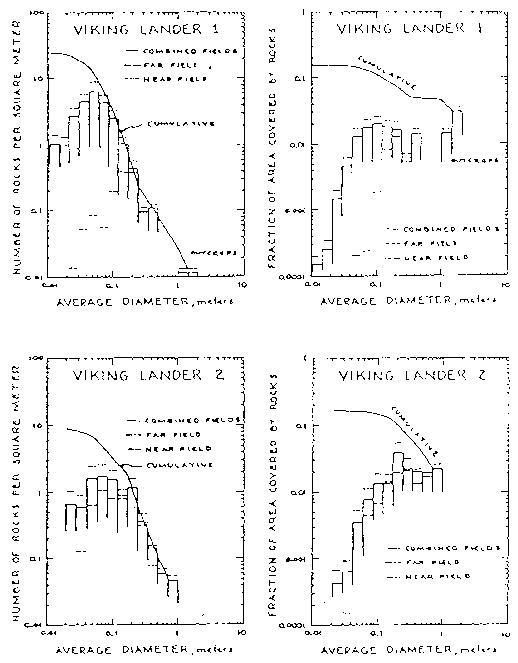
Map units are: (1) fine, (2) soillike, and (3) rock materials. Coordinates, length (L), width (W), and height (H) for each rock are recorded in a file for computational purposes. For many rocks, L or W was estimated. Size-frequency and area-covered distributions of rocks (Fig. 2) are derived from the file according to the surrounding map unit, field, and size. All rocks mapped within fine material and all rocks >0.25 m in the two fields are included in the distributions, but rocks <0.25 m in the soillike areas of the far fields are assumed to have the same distribution as rocks <0.25 m in the soillike areas of the near fields.
The forms of our size-frequency distributions of rocks are similar to previous ones [2,4]. Frequencies of rocks >0.18 m are larger at Lander 2 than Lander 1, but the reverse is true for smaller rocks. Fractions of area covered by the larger rocks in logarithmic size-bins are irregular and yield no simple relations for extrapolations to larger sizes of rocks, but the areas covered by small rocks diminish rapidly with decreasing size (Fig. 2). Our fractions of area covered by centimeter-size and larger objects and rocks are about 0.12 at Lander 1 and about 0.16 at Lander 2. Outcrops of rock cover an additional 4.5% of the area at the Lander 1 site. These fractions of area are comparable to those estimated for the sites from Viking Orbiter thermal data for rock abundances with unspecified size-frequency distributions, but assumed to be equivalent to rock surfaces about 0.10 to 0.15 m across [5].
We suggest that the following equation [6] for the fraction of area covered by rocks larger than 0.10 m could be used for preliminary design and planning studies because mathematical descriptions of Martian rock populations are unknown and the possibilities are large [7]:
				  -0.66
                         A = C * D
where A is the fraction of area covered by rocks with diameters larger than D (in meters) and C varies with location on Mars.
For various locations, we also suggest that C can be adjusted to give values of A that match those of rock abundance maps [5b]. In reality, the exponent on D varies. For ejecta from craters in rock, the exponent on D can vary with the size interval considered and distance from the crater; values may range from -3, or so, to even positive ones. Values of C for craters also vary and may be near zero for alluvium. For the Moon, a nominal value for the exponent on D is -O. 5.
REFERENCES
[l] Moore, H.J. and Keller, J.M., l990, NASA TM 4210, p. 533-
535. [2] Moore, H.J., et al., 1987, U.S.Geol. Survey Prof.
Paper 1389, 222p. [3] Liebes, S. Jr., 1982, NASA CR 3568,
290p. [4] Binder, A., et al., 1977, J.G.R., v. 82, p. 4439-
4451. [5] Christensen, P.R., (a) 1982, J.G.R., v. 87, p. 4439-
4451; (b) 1986, Icarus, v. 68, p. 217-238. [6] Moore H.J. and
Jakosky, B.M., 1989, Icarus, v. 81, p. 164-184. [7] Malin,
M.C., 1989, NASA TM 4130, p. 363-365.
Figure 1.
(Click on image to obtain full size Map )
Surface Material Maps of Viking Landing Sites on Mars; H. J. Moore,
U. S. Geological Survey, Menlo Park, CA, 94025; J. M. Keller, Stanford
University, Stanford, CA, 94309.
Surface-material map at the Viking 1 site.
Mapped area is divided into a near field (A) and a far field (B).
{{The near field is enclosed by the solid line surrounding the area
centered approximately on x=0, y=+3. The far field includes all of the
area within the large solid line, excluding that of the near field.}}
The population of rocks <0.25 m within the soillike areas of the far
field are assumed to be the same as those for soillike areas in the
near field. Coordinates are in meters from center of Lander 1 (0,0).
Figure 2.
-
Prepared by: James E Tillman and George F LeCompte,
from ideas and text of Henry J Moore.

