Download and Analysis of
Earth-Based Temperature Data
 |

Photo Courtesy NASA |
Note: Print this handout so you can refer to it during this activity.
Temperature is a fundamental physical concept--it's an easy measurement
to make and relate to, and it can teach us so much about how the Earth and
other planetary systems work. This is only the beginning of an Earth/Mars
atmospheric temperature comparison unit from which we can expand our knowledge
about both unique planets.
- Download the "Temperature
data from a mast like Pathfinder's" data files from
the Live from Earth and Mars Web site by clicking on "Data
Interchange Format." Save the file to your computer's desktop so you
can find it easily.
- Launch a spreadsheet program. Load the data file (Profile4.bin)
into the spreadsheet through File > Open. You should see weather data
for July 19-21, 1997 (during the Mars Pathfinder mission). These data were
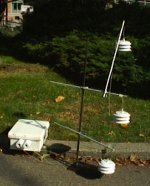
collected from an automated device (above left) that records half-hour
averages at three heights -- 0.25 m, 0.50 m, and 1.00 m -- and represents
an analog of the Mars Pathfinder data.
- Peruse the data to familiarize yourself with what is there.
We will focus on the temperature data here, and compare it to the Mars
data from the Download and Analysis
of Mars-Based Temperature Data activity you may have completed
already (see below). Look for patterns within the data.
- Chart the temperature data by selecting the temperature columns
and choosing a line graph. This will allow you to graph the temperature
data row by row (i.e. half-hour periods) without having to create a time
axis.
- Describe the diurnal cycle of temperature you find in this data
set. Does it vary from day to day? Do you think that the rate of cooling
and heating represented in these data is symmetric for a given day? Hypothesize
about your observations above. What was the weather like on the days represented
- clear, cloudy, rainy, foggy, etc.?
Comparing Earth and Mars--to be done after completing
the Download and Analysis of Mars-Based
Temperature Data activity.
- Compare your graph of the diurnal cycle of temperature on Earth
with the Pathfinder data. You can open another spreadsheet window on
your computer and view the plots together, or you can try to print your
charts and compare them. What are the similarities and differences? How
might they be explained?
- Returning to the Pathfinder data, observe the "profiles"
of temperatures near the Martian surface (i.e. the variation of temperature
with height). Describe the profiles for a Martian sol. Does the pattern
change over a day? Are the temperature differences over height similar
to the Earth data? How might the pattern be explained?
Final Notes:
The temperature mast (above left) is very similar to the one used on
the Pathfinder mission (above right). We measured the temperature profile
over blacktop over a sunny Summer Seattle weekend. What differences would
we see if we collected data: in the shade; while it was raining; today;
or, at another latitude? How would you go about designing such an
investigation?
© 1998 Live
from Earth and Mars, Janice DeCosmo, and Rich Edgerton

