


Next: 4.4.3.5 Cartesian time axes
Up: 4.4.3 Map frame and
Previous: 4.4.3.3 Cartesian log axes
Contents
Index
Normally, stride will be used to create equidistant (in the user's unit) annotations
or ticks, but because of the exponential nature of the axis, such annotations may converge
on each other at one end of the axis. To avoid this problem, you can
append p to stride, and the annotation
interval is expected to be in transformed units, yet the annotation itself will be plotted
as un-transformed units. E.g., if stride = 1 and power = 0.5 (i.e., sqrt),
then equidistant annotations labeled 1, 4, 9, ... will appear.
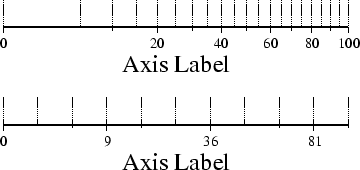
Figure 4.10:
Exponential or power projection axis. (top) Using an exponent of 0.5
yields a  axis. Here, intervals refer to actual data values, in
-R0/100/0/1 -JX3p0.5/0.4 -Ba20f10g5.
(bottom) Here, intervals refer to projected values, although the annotation
uses the corresponding unprojected values, as in -Ba3f2g1p.
axis. Here, intervals refer to actual data values, in
-R0/100/0/1 -JX3p0.5/0.4 -Ba20f10g5.
(bottom) Here, intervals refer to projected values, although the annotation
uses the corresponding unprojected values, as in -Ba3f2g1p.
 |
Next: 4.4.3.5 Cartesian time axes
Up: 4.4.3 Map frame and
Previous: 4.4.3.3 Cartesian log axes
Contents
Index
Paul Wessel
2004-10-01