This projection uses
![]() and allows us to explore exponential relationships like x
and allows us to explore exponential relationships like x![]() versus y
versus y![]() .
While
.
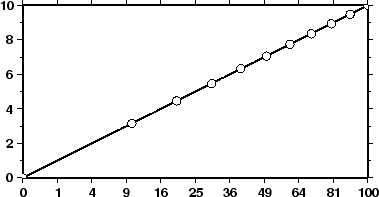
While ![]() and
and ![]() can be any values, we will select
can be any values, we will select ![]() and
and ![]() which means we will plot
which means we will plot ![]() versus
versus ![]() .
We indicate this scaling by appending a p (lower case P) followed
by the desired exponent, in our case 0.5. Since
.
We indicate this scaling by appending a p (lower case P) followed
by the desired exponent, in our case 0.5. Since ![]() we do not
need to specify p1 since it is identical to the linear transformation.
Thus our command becomes
we do not
need to specify p1 since it is identical to the linear transformation.
Thus our command becomes
psxy -R0/100/0/10 -Jx0.3ip0.5/0.15i -Ba1p/a2f1WSne -W1p -P -K sqrt.d > GMT_pow.ps
psxy -R -Jx -Sc0.075i -Gwhite -W -O sqrt.d10 >> GMT_pow.ps