Table 2. New Plots
| Product | 2017100800 | 2017100812 | 2017100818 | 2017100900 |
|---|
| | | | |
| Paper Figures | | | | |
| Zoomed in horizontal paper figures | |
All
Shaded relief
| | |
| 4-panel Fig 14
|
| 6-panel Fig 15
|
| 5-panel Fig 16
|
| 4-panel Fig 17
|
| 8-panel Fig 18
|
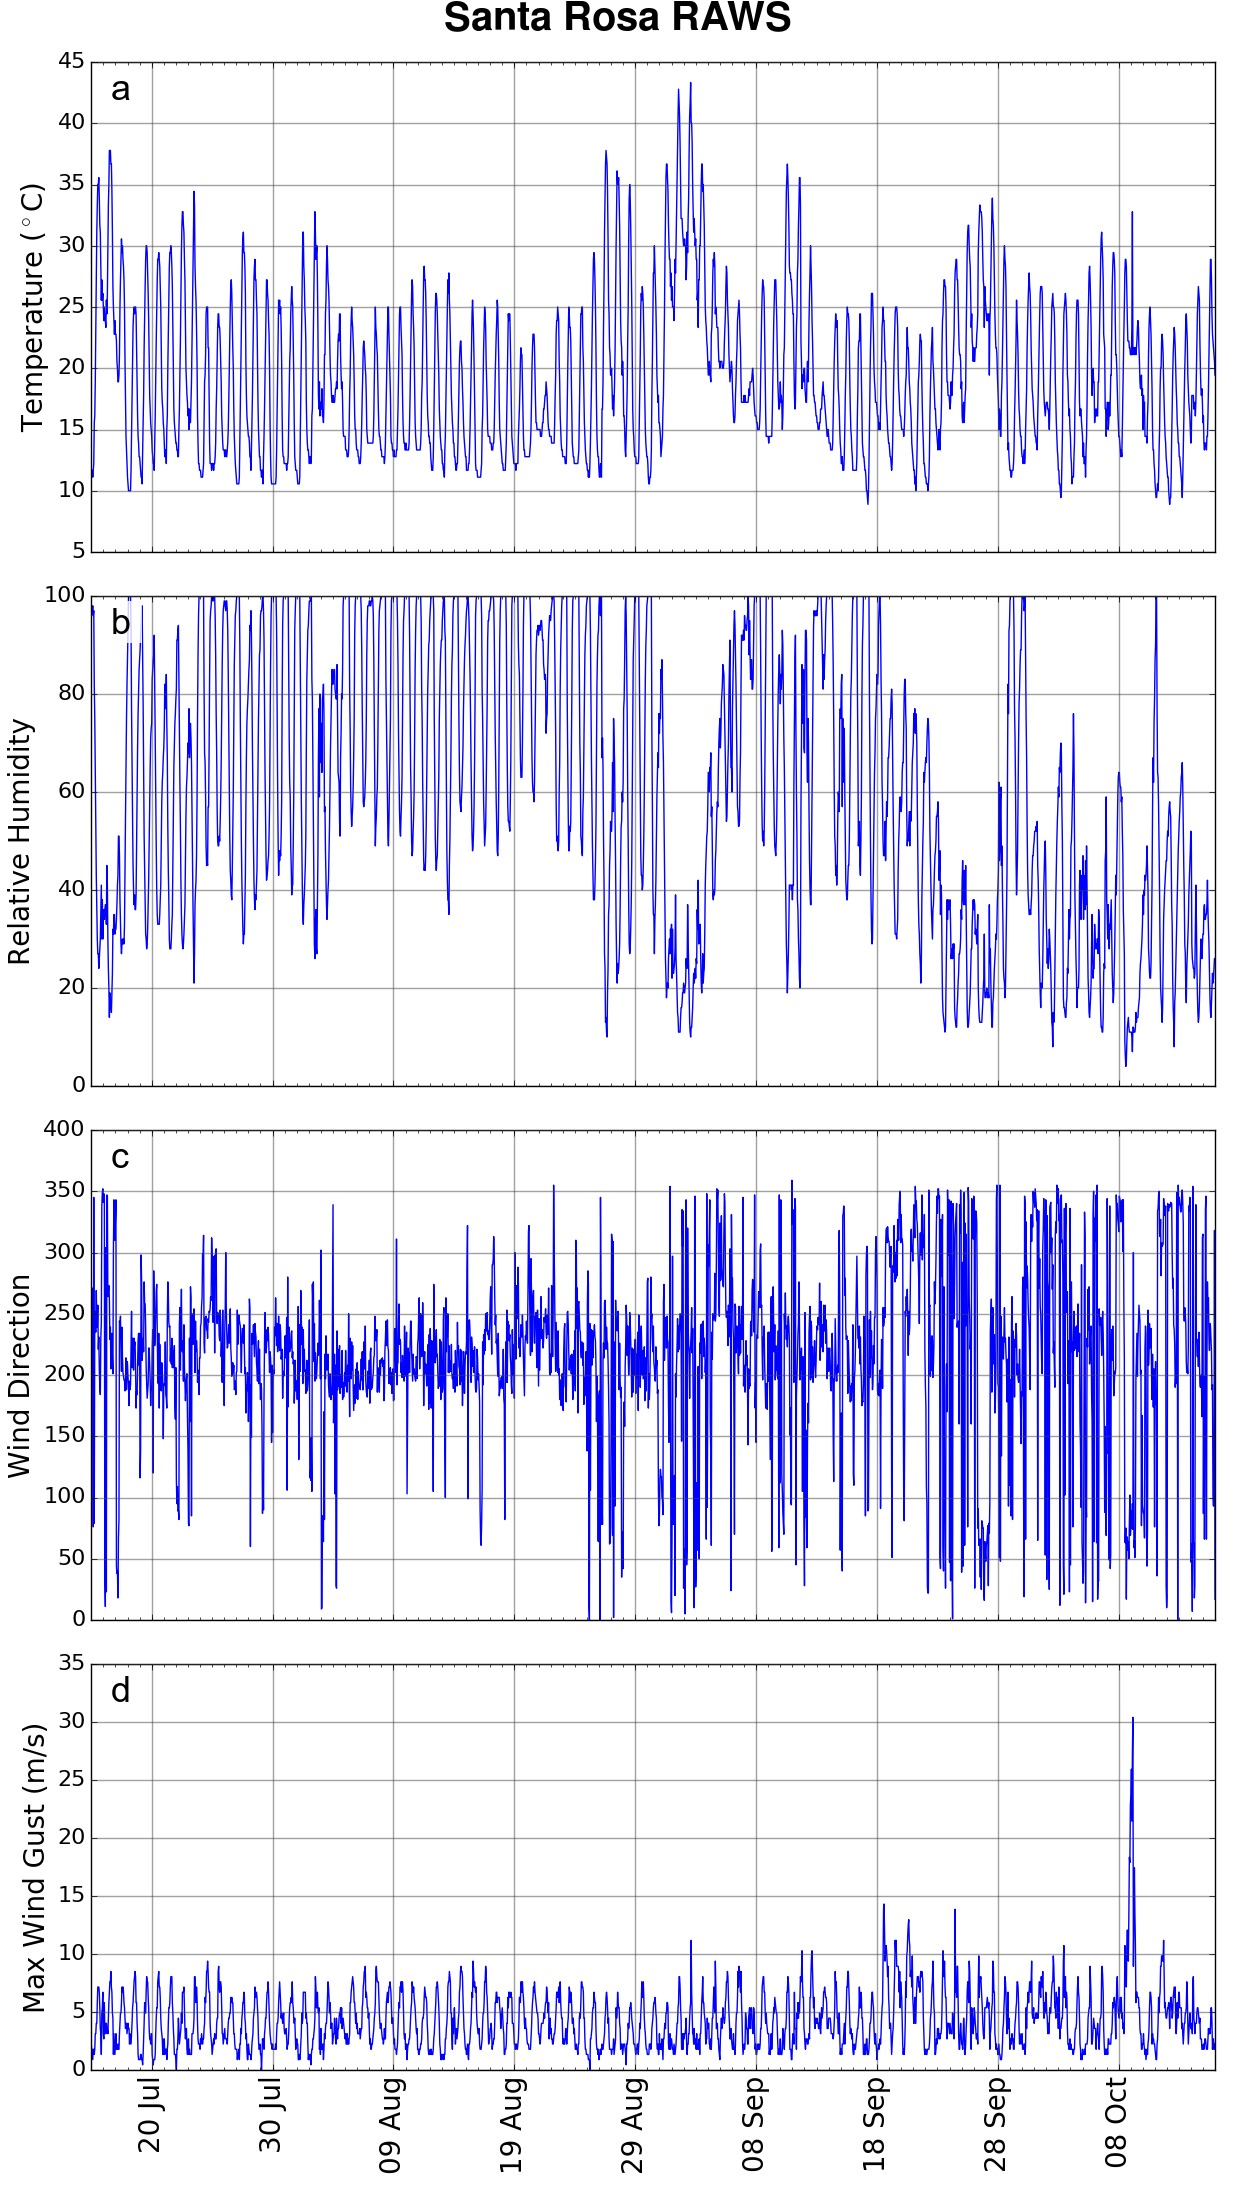
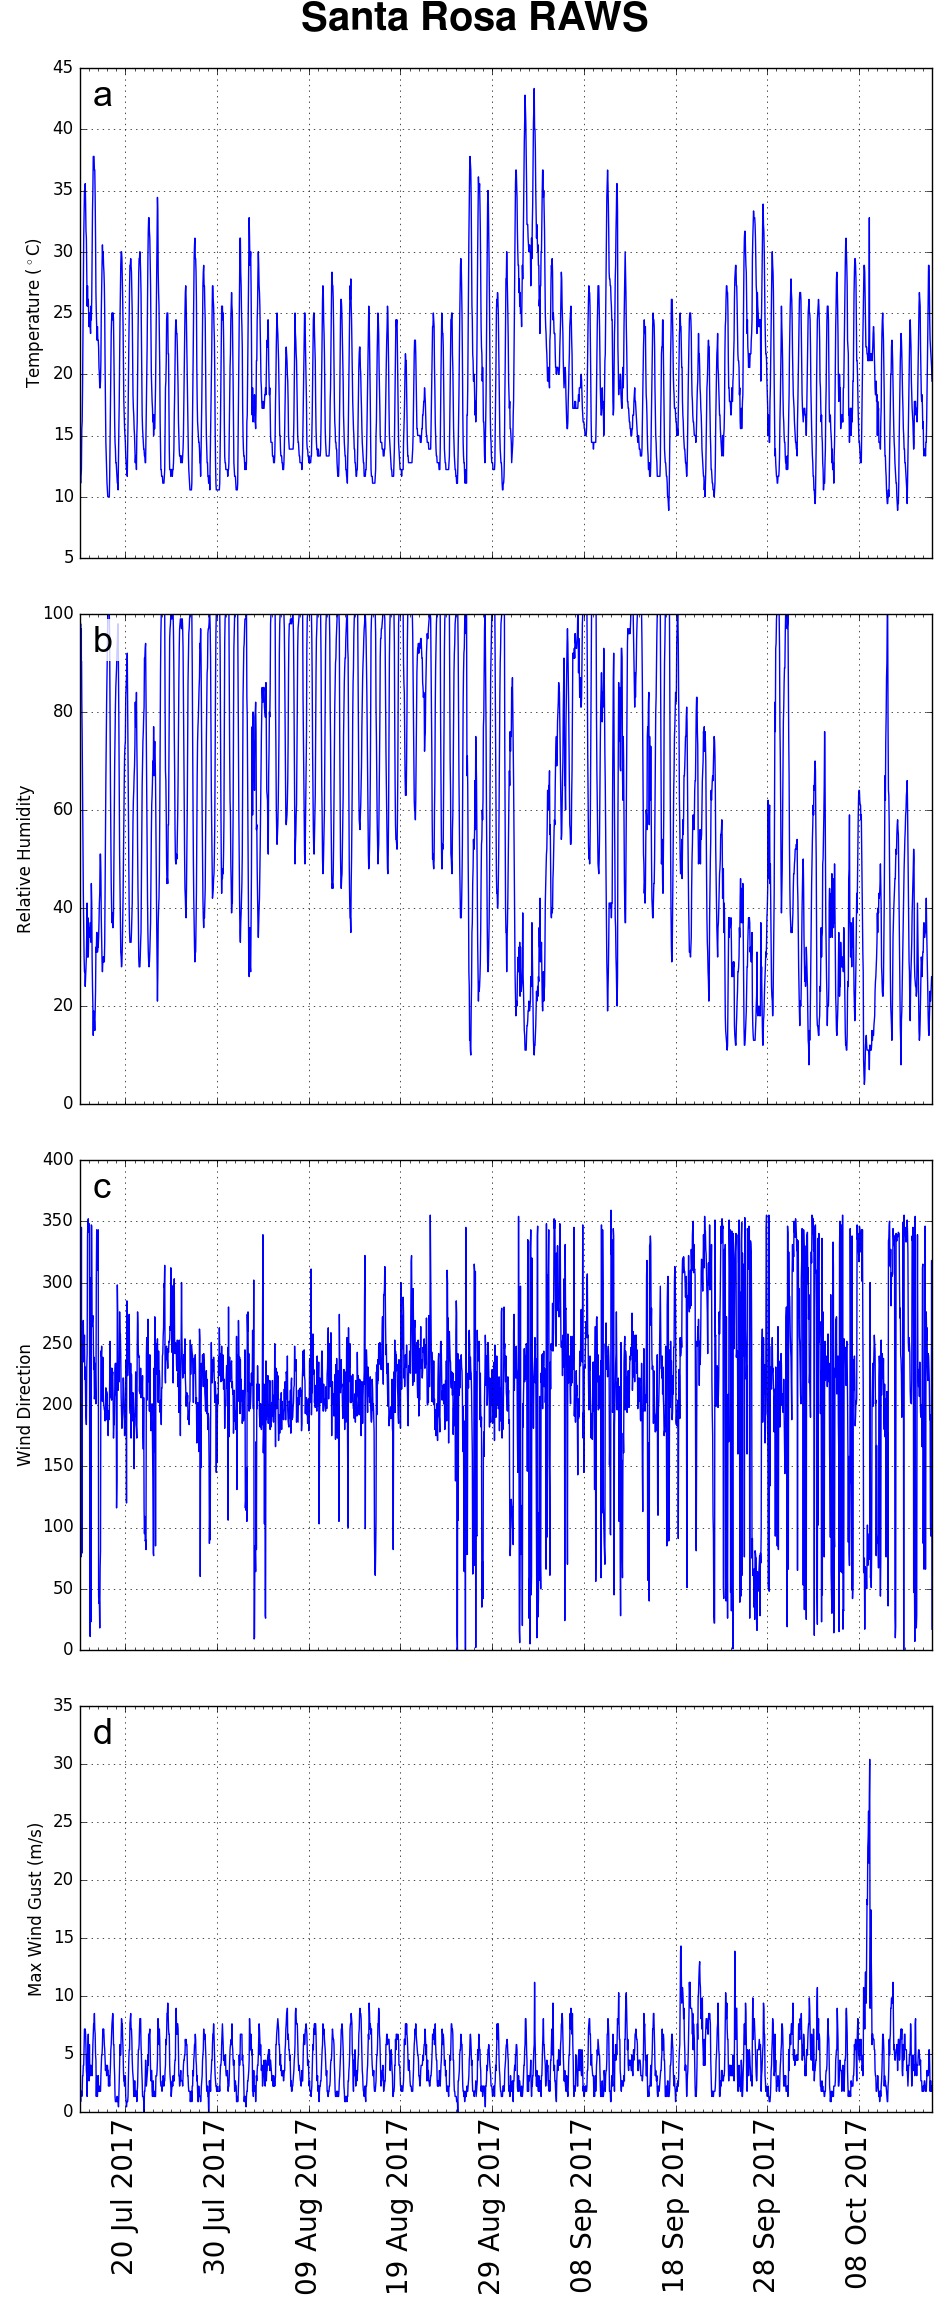
| Fig 2b
|
| Fig 19 trajectories
|
| Fig 7
|
| GFS SLP forecasts valid at 09 OCT 17 0600 UTC
|
| Fig 21
|
| | | | |
| Alternate Figures | | | | |
| 6-panel Fig 15
|
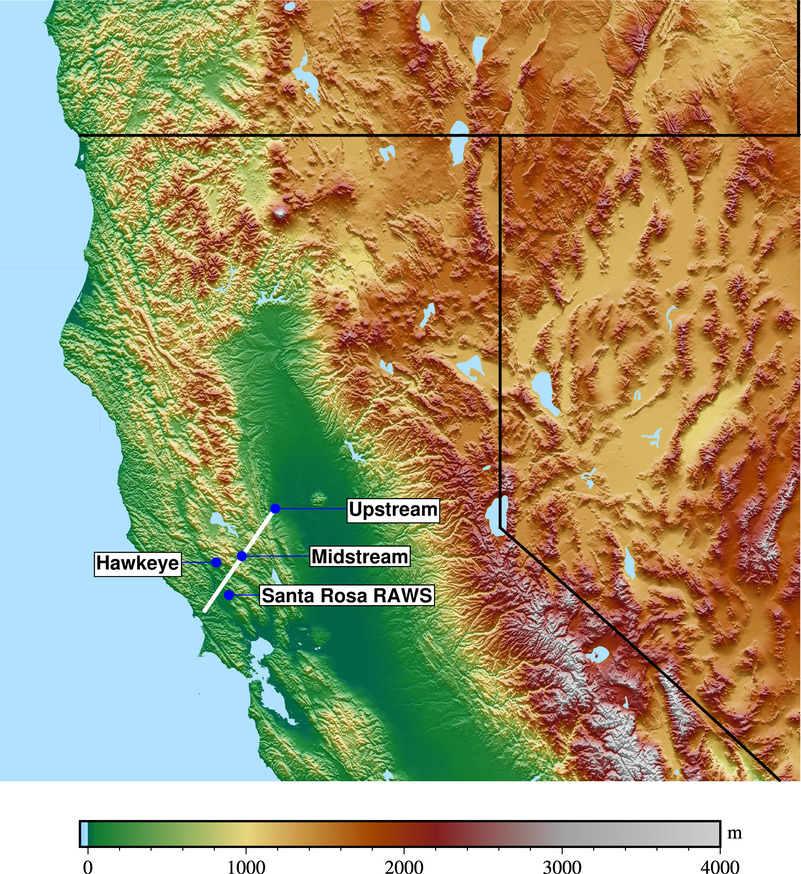
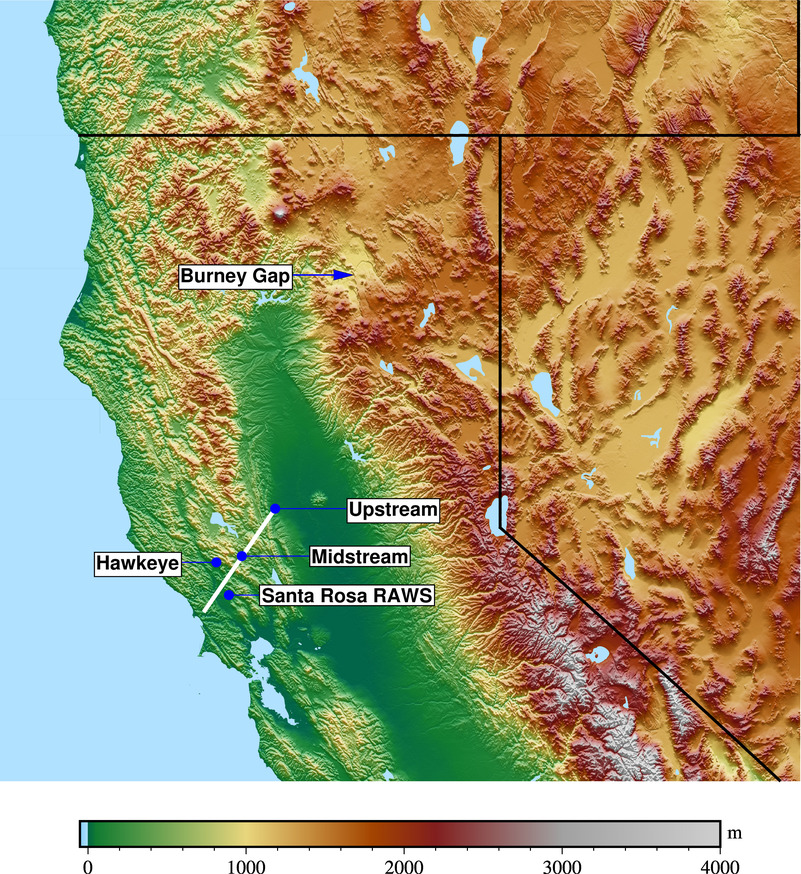
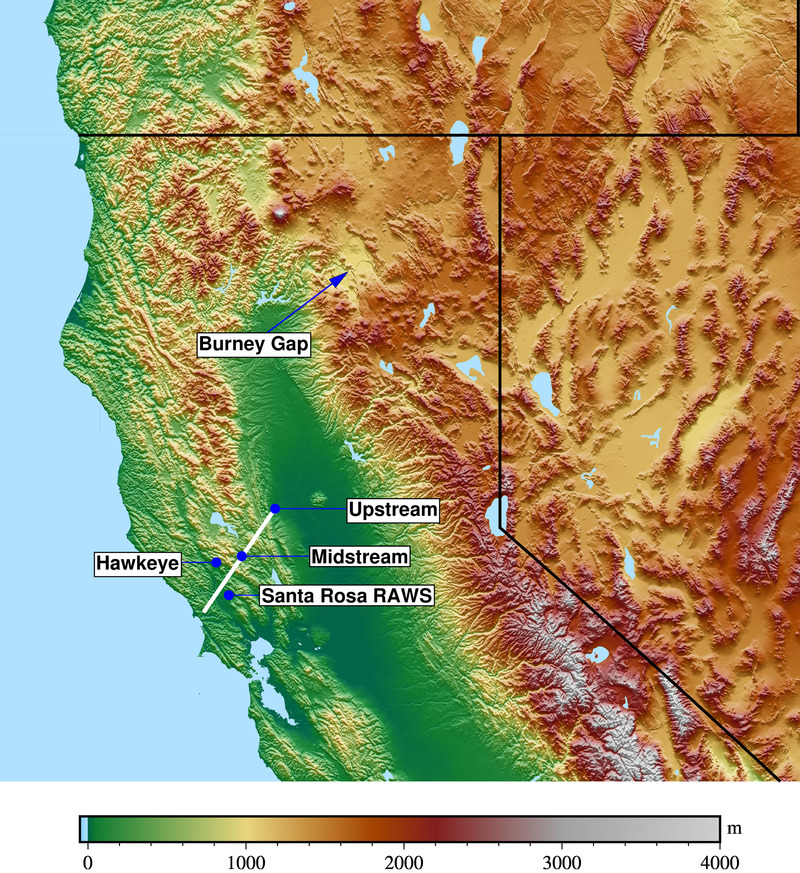
| Google Terrain Map with Station and Sounding Locations | | | | |
| wsp level 6 above ground whole domain | | All | | |
| wsp level 6 above ground zoomed in | | All | | |
| surface wind speed zoomed in | | All | | |
| Maximum wind speed below 1000m AGL | | All | | |
| Pressure at Maximum wind speed below 1000m AGL | | All | | |
| Elevation at Maximum wind speed below 1000m AGL | | All | | |
| | | | |
| Relative Humidity Plots | | | | |
| Vertical Cross section of RH to 500 hPa along cxzoom1 section | |
All
Hr 17 |
| |
| Horizontal RH at 900 hPa | | All | | |
| Horizontal RH at 700 hPa | | All | | |
| | | | |
| Trajectories | | | | |
| Comparing Model Output Interval and Trajectory Interpolation Times | |
All sites (blue is 6min output interpolated to 1 minute) | | |
| Ending at Santa Rosa RAWS | |
Fcst Hours 5 to 17
Fcst Hours 6 to 17
Fcst Hours 11 to 17
| | |
| Ending at Santa Rosa Downtown | |
Fcst Hours 5 to 17
Fcst Hours 6 to 17
Fcst Hours 11 to 17
| | |
| Ending at Sonoma County Airport | |
Fcst Hours 5 to 17
Fcst Hours 6 to 17
Fcst Hours 11 to 17
| | |
| | | | |
| Maximum wind speed plots | | | | |
| Maximum wind speed below 500m AGL | | All | | |
| Pressure at Maximum wind speed below 500m AGL | | All | | |
| Elevation at Maximum wind speed below 500m AGL | | All | | |
| Maximum wind speed below 250m AGL | |
All Hours
Hour 17
All levels at hour 17
| | |
| Pressure at Maximum wind speed below 250m AGL | | All | | |
| Elevation at Maximum wind speed below 250m AGL | | All | | |
| Vertical cross section: Winds and Circulation Vectors | |
Pressure Coordinates
Height Coordinates
| | |
| Vertical cross section: Winds and Horizontal Wind Barbs | |
Pressure Coordinates
Height Coordinates
| | |
| Vertical cross section Pixellated Version: Winds and Circulation Vectors | |
Pressure Coordinates
Height Coordinates
| | |
| Vertical cross section Pixellated Version: Winds and Horizontal Wind Barbs | |
Pressure Coordinates
Height Coordinates
| | |
| Zoomed in Cross Sections | | | | |
| Map of zoomed in cross section locations | |
Max winds below 1000m, All Hours
Max winds below 1000m,Hour 17
Max winds below 500m, All Hours
Max winds below 500m,Hour 17
Max winds below 250m, All Hours
Max winds below 250m,Hour 17
Compare MANY levels at hour 17
Terrain
| | |
| Section 1 | | | | |
| Cross section locations and Max Wind Speeds below specified height | |
below 1000m
below 500m
below 250m
Compare levels at hour 17
| | |
| Vertical cross section1 zoomed | |
All plots, All Hours
All plots, Hour 17
| | |
| Vertical cross section1 zoom: Winds and Circulation Vectors | |
Pressure Coordinates
Height Coordinates
| | |
| Vertical cross section1 zoom: Winds and Horizontal Wind Barbs | |
Pressure Coordinates
Height Coordinates
| | |
| Vertical cross section1 zoom Pixellated Version: Winds and Circulation Vectors | |
Pressure Coordinates
Height Coordinates
| | |
| Vertical cross section1 zoom Pixellated Version: Winds and Horizontal Wind Barbs | |
Pressure Coordinates
Height Coordinates
| | |
| Section 2 | | | | |
| Vertical cross section2 zoomed | |
All plots, All Hours
All plots, Hour 17
| | |
| Vertical cross section2 zoom: Winds and Circulation Vectors | |
Pressure Coordinates
Height Coordinates
| | |
| Vertical cross section2 zoom: Winds and Horizontal Wind Barbs | |
Pressure Coordinates
Height Coordinates
| | |
| Vertical cross section2 zoom Pixellated Version: Winds and Circulation Vectors | |
Pressure Coordinates
Height Coordinates
| | |
| Vertical cross section2 zoom Pixellated Version: Winds and Horizontal Wind Barbs | |
Pressure Coordinates
Height Coordinates
| | |
| Section 3 | | | | |
| Compare zoomed cross sections at hour 17 | |
Pressure
Height
| | |
| Vertical cross section3 zoomed | |
All plots, All Hours
All plots, Hour 17
| | |
| Vertical cross section3 zoom: Winds and Circulation Vectors | |
Pressure Coordinates
Height Coordinates
| | |
| Vertical cross section3 zoom: Winds and Horizontal Wind Barbs | |
Pressure Coordinates
Height Coordinates
| | |
| Vertical cross section3 zoom Pixellated Version: Winds and Circulation Vectors | |
Pressure Coordinates
Height Coordinates
| | |
| Vertical cross section3 zoom Pixellated Version: Winds and Horizontal Wind Barbs | |
Pressure Coordinates
Height Coordinates
| | |
| | | | |
| Full cross section, theta and temperature plots | | | | |
| Vertical cross section: Theta and Circulation Vectors | | Pressure Coordinates | | |
| Vertical cross section: Theta and Horizontal Wind Barbs | | Pressure Coordinates | | |
| Vertical cross section: Temperature and Circulation Vectors | | Pressure Coordinates | | |
| Vertical cross section: Temperature and Horizontal Wind Barbs | | Pressure Coordinates | | |
| | | | |
| Soundings | | | | |
Google Terrain Map with Station and Sounding Locations
Big RIP plot of sounding locations
Zoomed in RIP plot of sounding locations
| | | | |
| Soundings at Sounding1 |
All
skewt
stuve
|
All
All skewt
All stuve
All to 600 hPa
skewt to 600 hPa
stuve to 600 hPa
stuve
to 600 hPa at hour 17
All to 500 hPa
skewt to 500 hPa
stuve to 500 hPa
All to 250 hPa
skewt to 250 hPa
stuve to 250 hPa
|
All
skewt
stuve
|
All
skewt
stuve
|
| Soundings at Sounding2 |
All
skewt
stuve
|
All
All skewt
All stuve
All to 600 hPa
skewt to 600 hPa
stuve to 600 hPa
All to 500 hPa
skewt to 500 hPa
stuve to 500 hPa
All to 250 hPa
skewt to 250 hPa
stuve to 250 hPa
|
All
skewt
stuve
|
All
skewt
stuve
|
| Soundings at Upstream1 |
All
skewt
stuve
|
All
All skewt
All stuve
All to 600 hPa
skewt to 600 hPa
stuve to 600 hPa
All to 500 hPa
skewt to 500 hPa
stuve to 500 hPa
All to 250 hPa
skewt to 250 hPa
stuve to 250 hPa
|
All
skewt
stuve
|
All
skewt
stuve
|
| Soundings at Upstream2 |
not available
|
All
All skewt
All stuve
All to 600 hPa
skewt to 600 hPa
stuve to 600 hPa
All to 500 hPa
skewt to 500 hPa
stuve to 500 hPa
All to 250 hPa
skewt to 250 hPa
stuve to 250 hPa
|
not available
|
not available
|
| Soundings at Midstream |
All
skewt
stuve
|
All
All skewt
All Stuve
All to 600 hPa
skewt to 600 hPa
stuve to 600 hPa
All to 500 hPa
skewt to 500 hPa
stuve to 500 hPa
All to 250 hPa
skewt to 250 hPa
stuve to 250 hPa
|
All
skewt
stuve
|
All
skewt
stuve
|
| Soundings at Downstream1 |
All
skewt
stuve
|
All
All skewt
All stuve
All to 600 hPa
skewt to 600 hPa
stuve to 600 hPa
All to 500 hPa
skewt to 500 hPa
stuve to 500 hPa
All to 250 hPa
skewt to 250 hPa
stuve to 250 hPa
|
All
skewt
stuve
|
All
skewt
stuve
|
| Soundings at Downstream2 |
All
skewt
stuve
|
All
All skewt
All stuve
All to 600 hPa
skewt to 600 hPa
stuve to 600 hPa
All to 500 hPa
skewt to 500 hPa
stuve to 500 hPa
All to 250 hPa
skewt to 250 hPa
stuve to 250 hPa
|
All
skewt
stuve
|
All
skewt
stuve
|
.*.jpg)
.gif)
.gif)
.gif)
.gif)
.*ysuv75.gif)
.gif)
.*.gif)
.*.gif)
.*.gif)
.*.gif)
.*.gif)
.*.gif)
.*.gif)
.*.gif)
.*.gif)
.*.17.*.gif)