| Description | Figure |
|---|---|
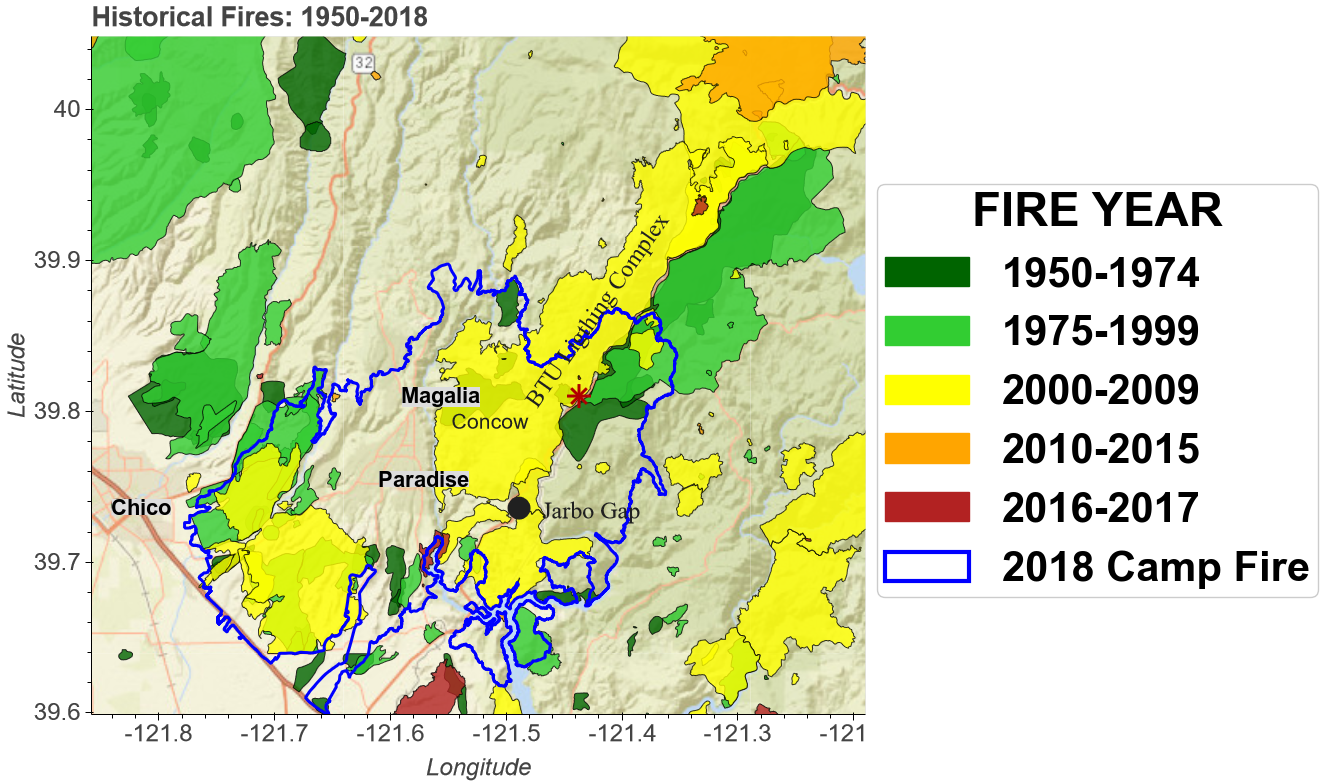
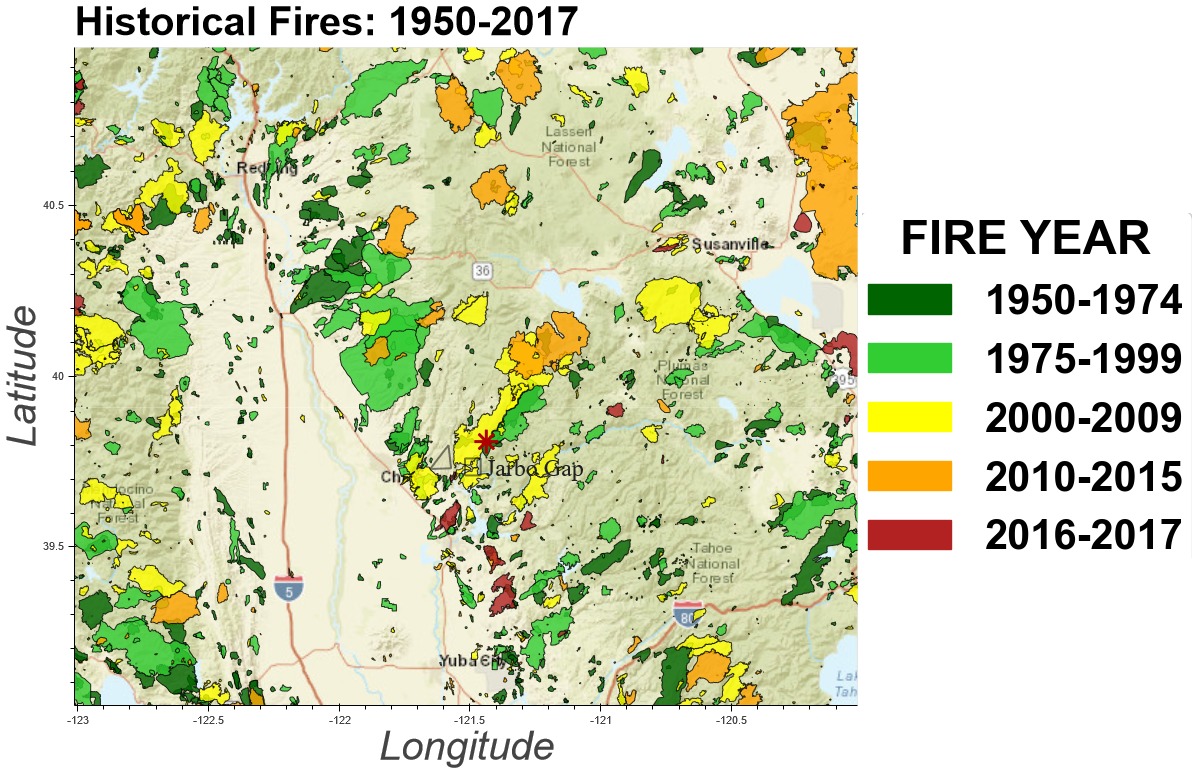
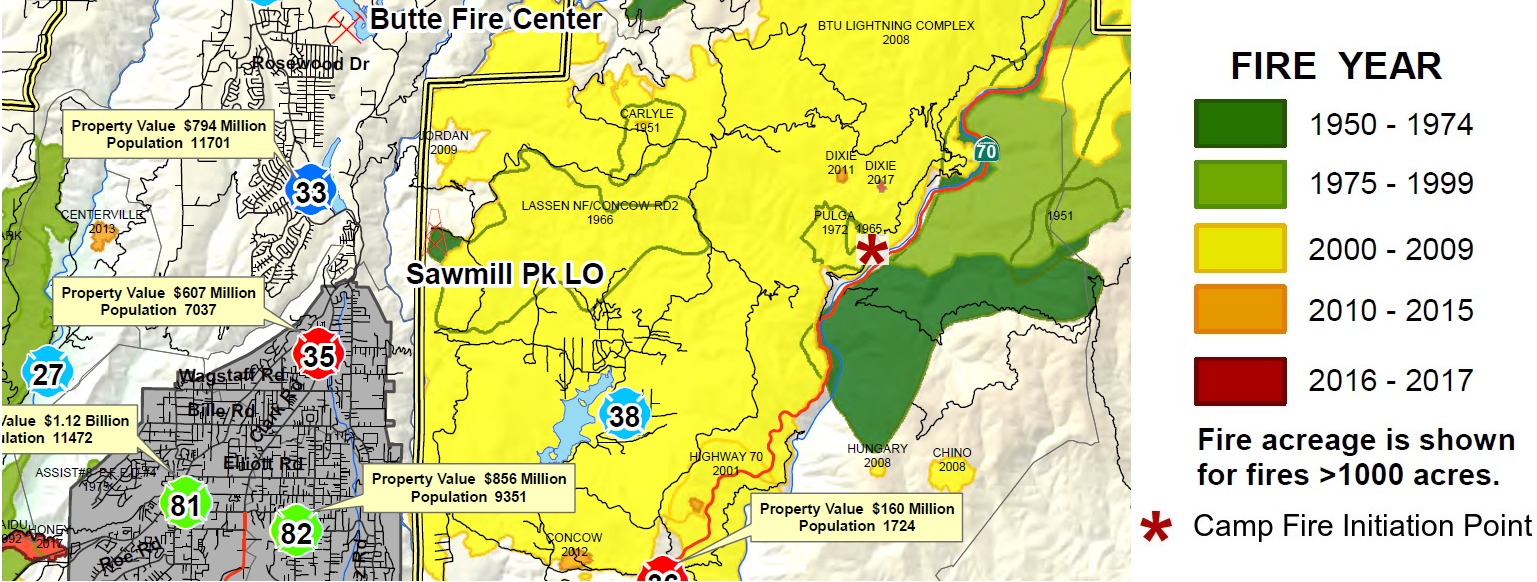
| Fig. 2 Butte County Hisotrical Fires |
LATEST, BEST, Self-created source, montage_fig2_new.png
Self-created source, montage_fig2_new.jpg From other source montage_paper_fig2.jpg |
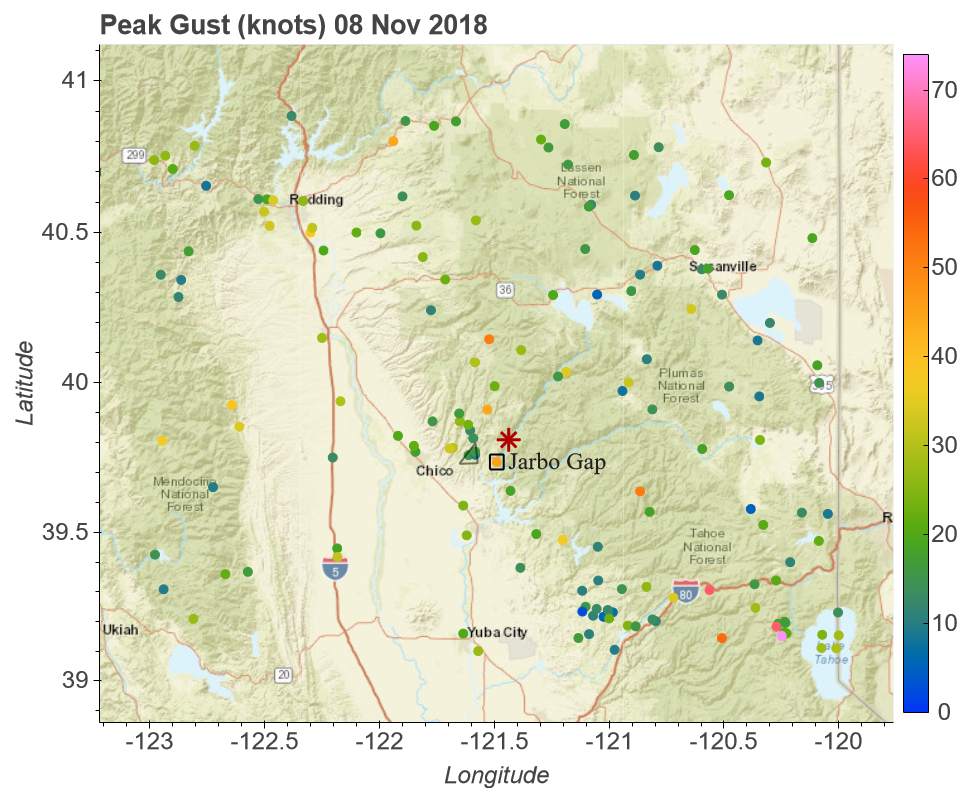
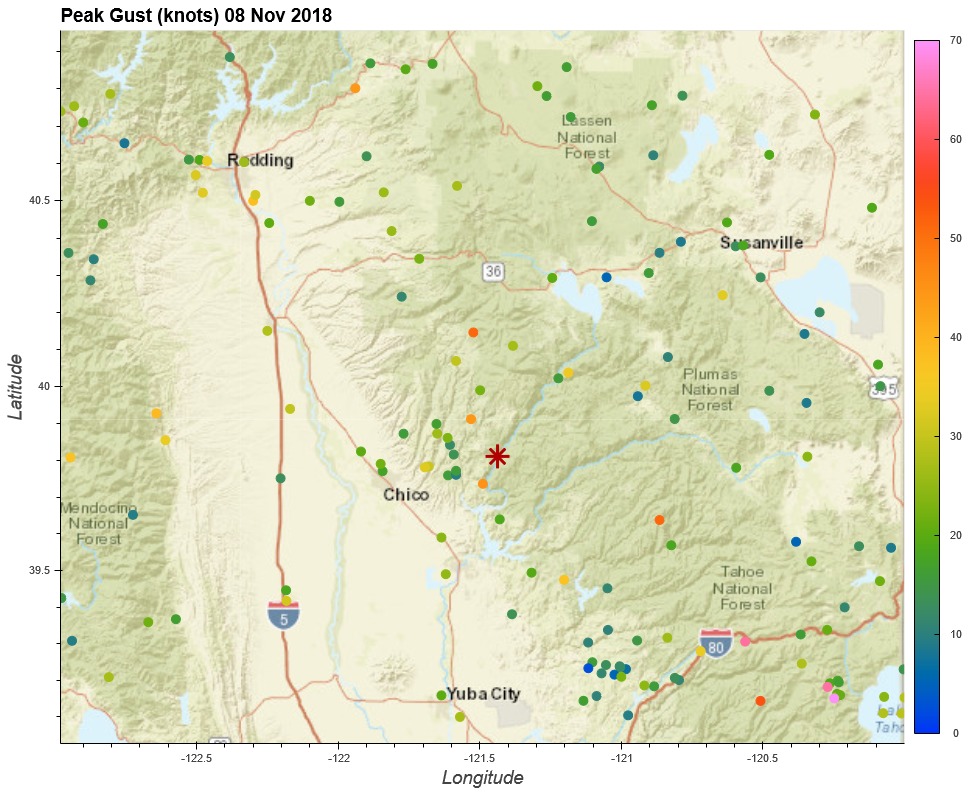
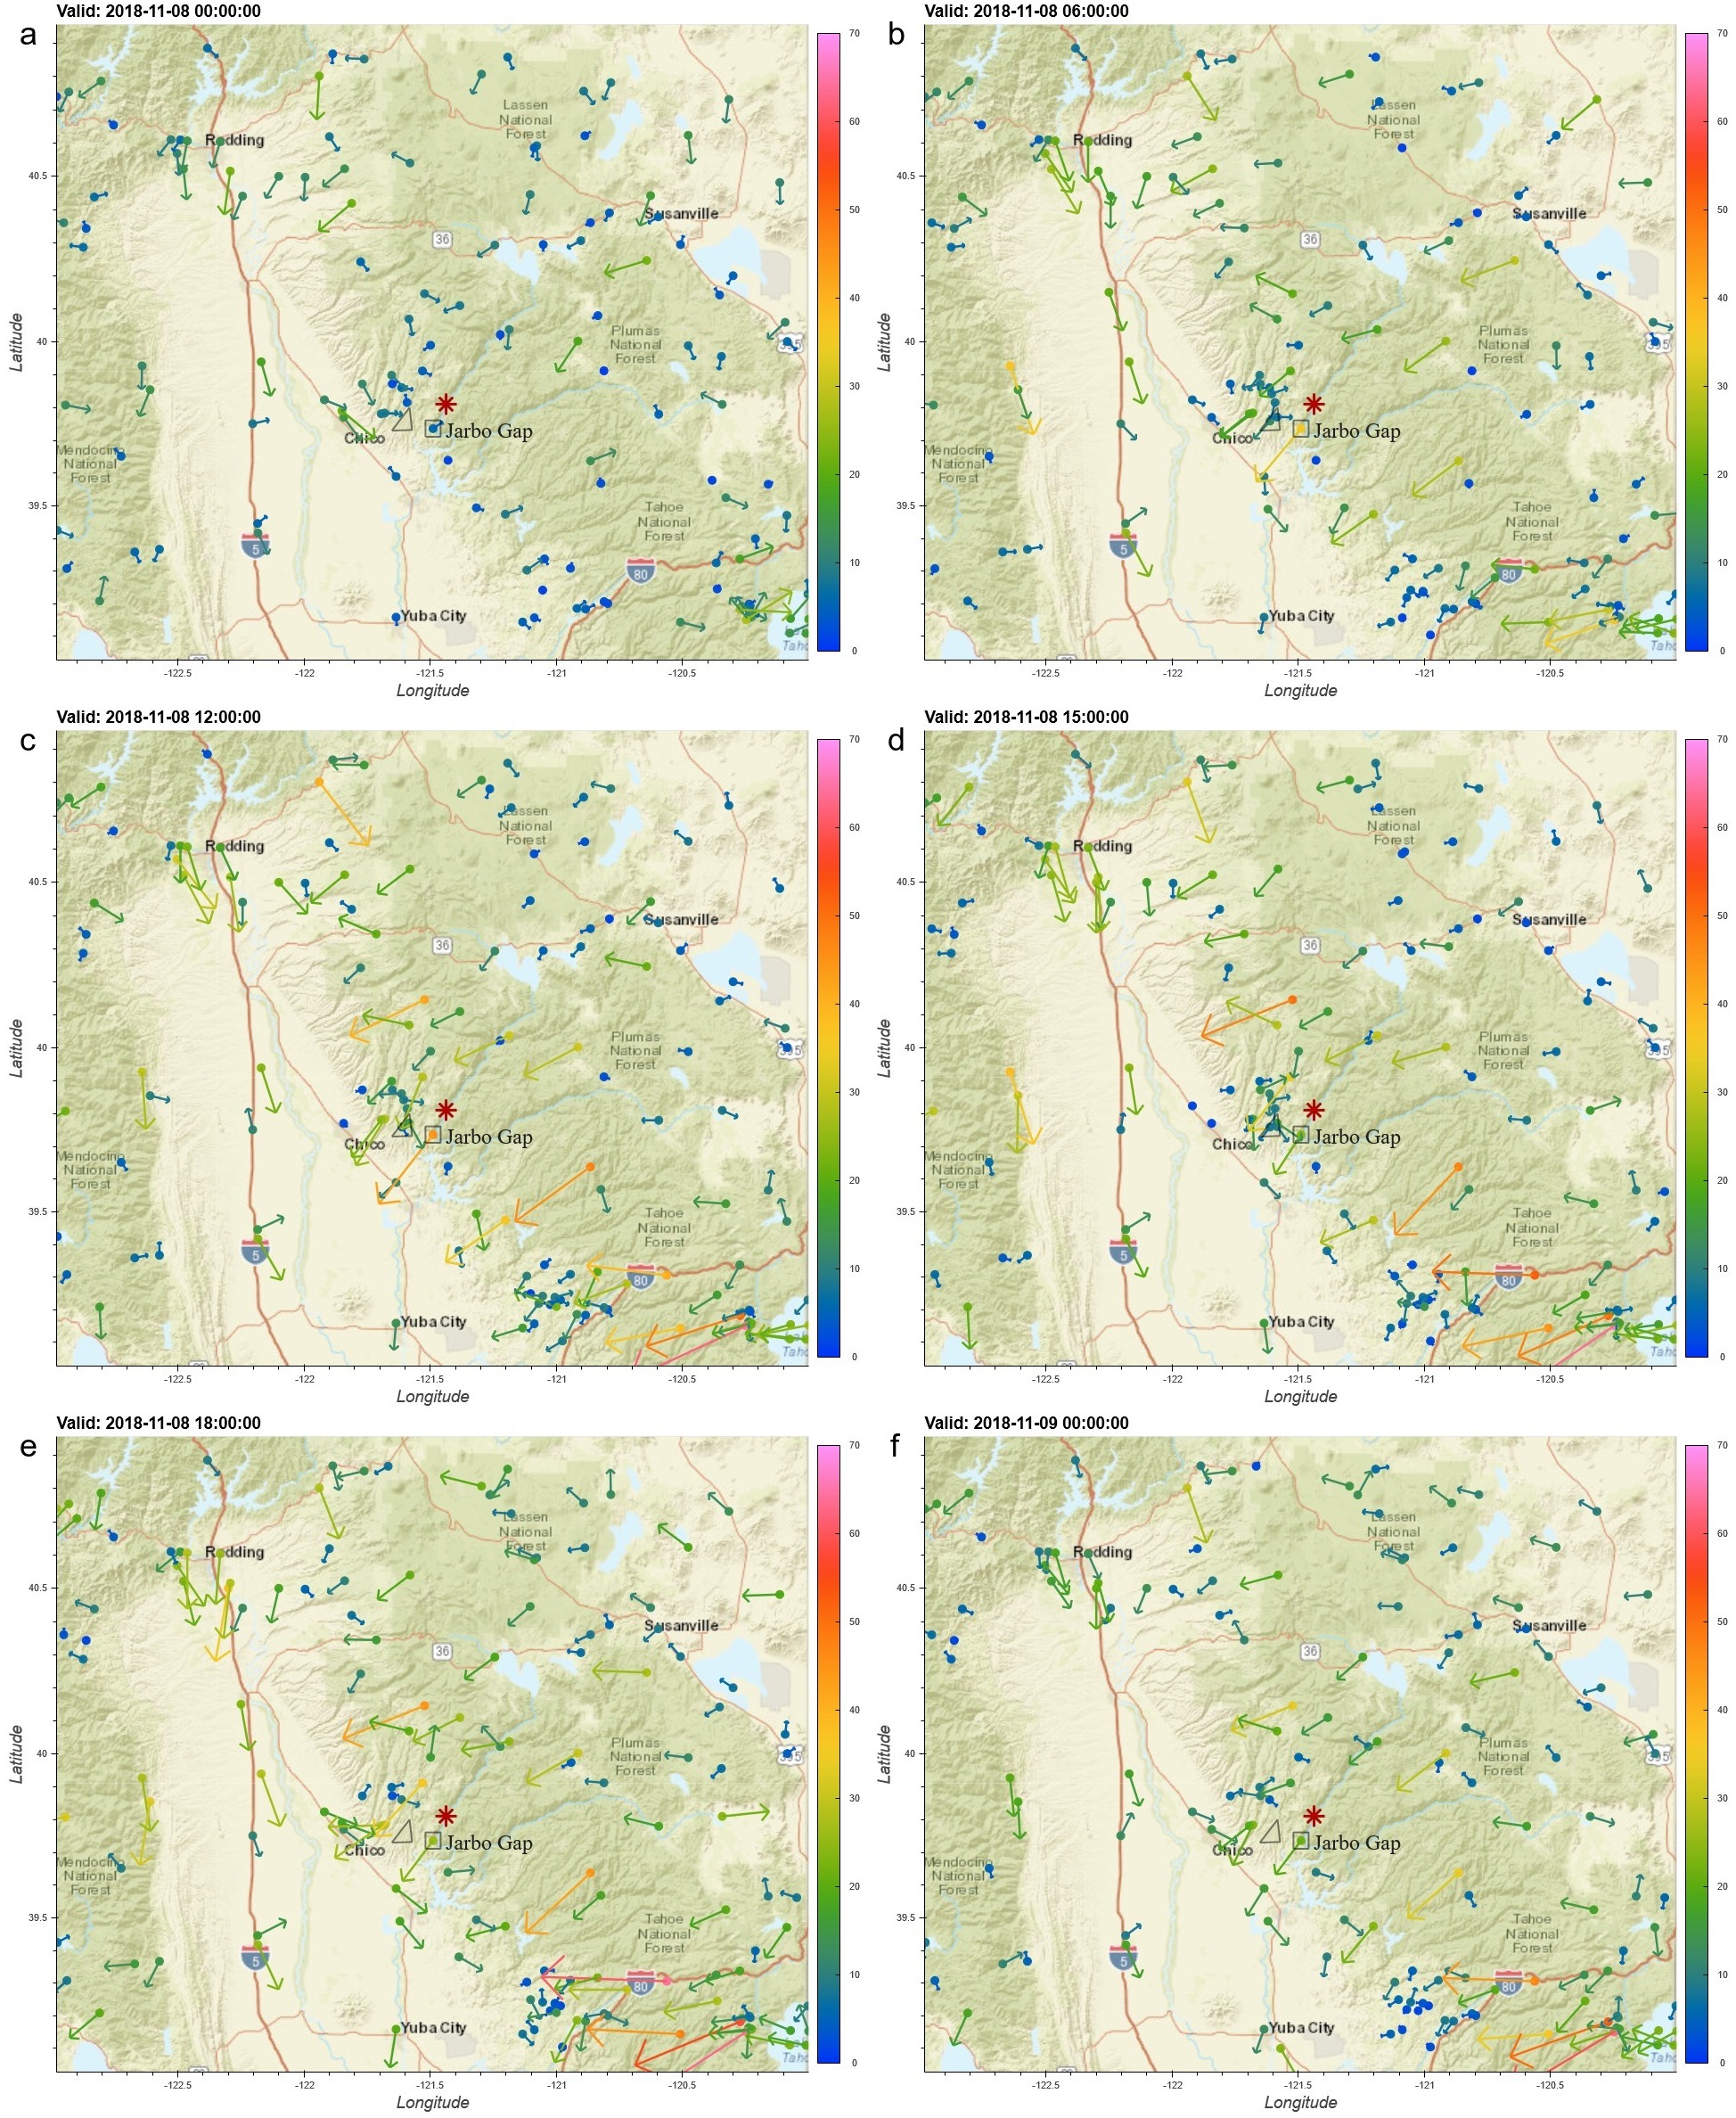
| Fig. 3 maximum wind gust for 8-9 Nov 2018 |
LATEST version
previous version loop |
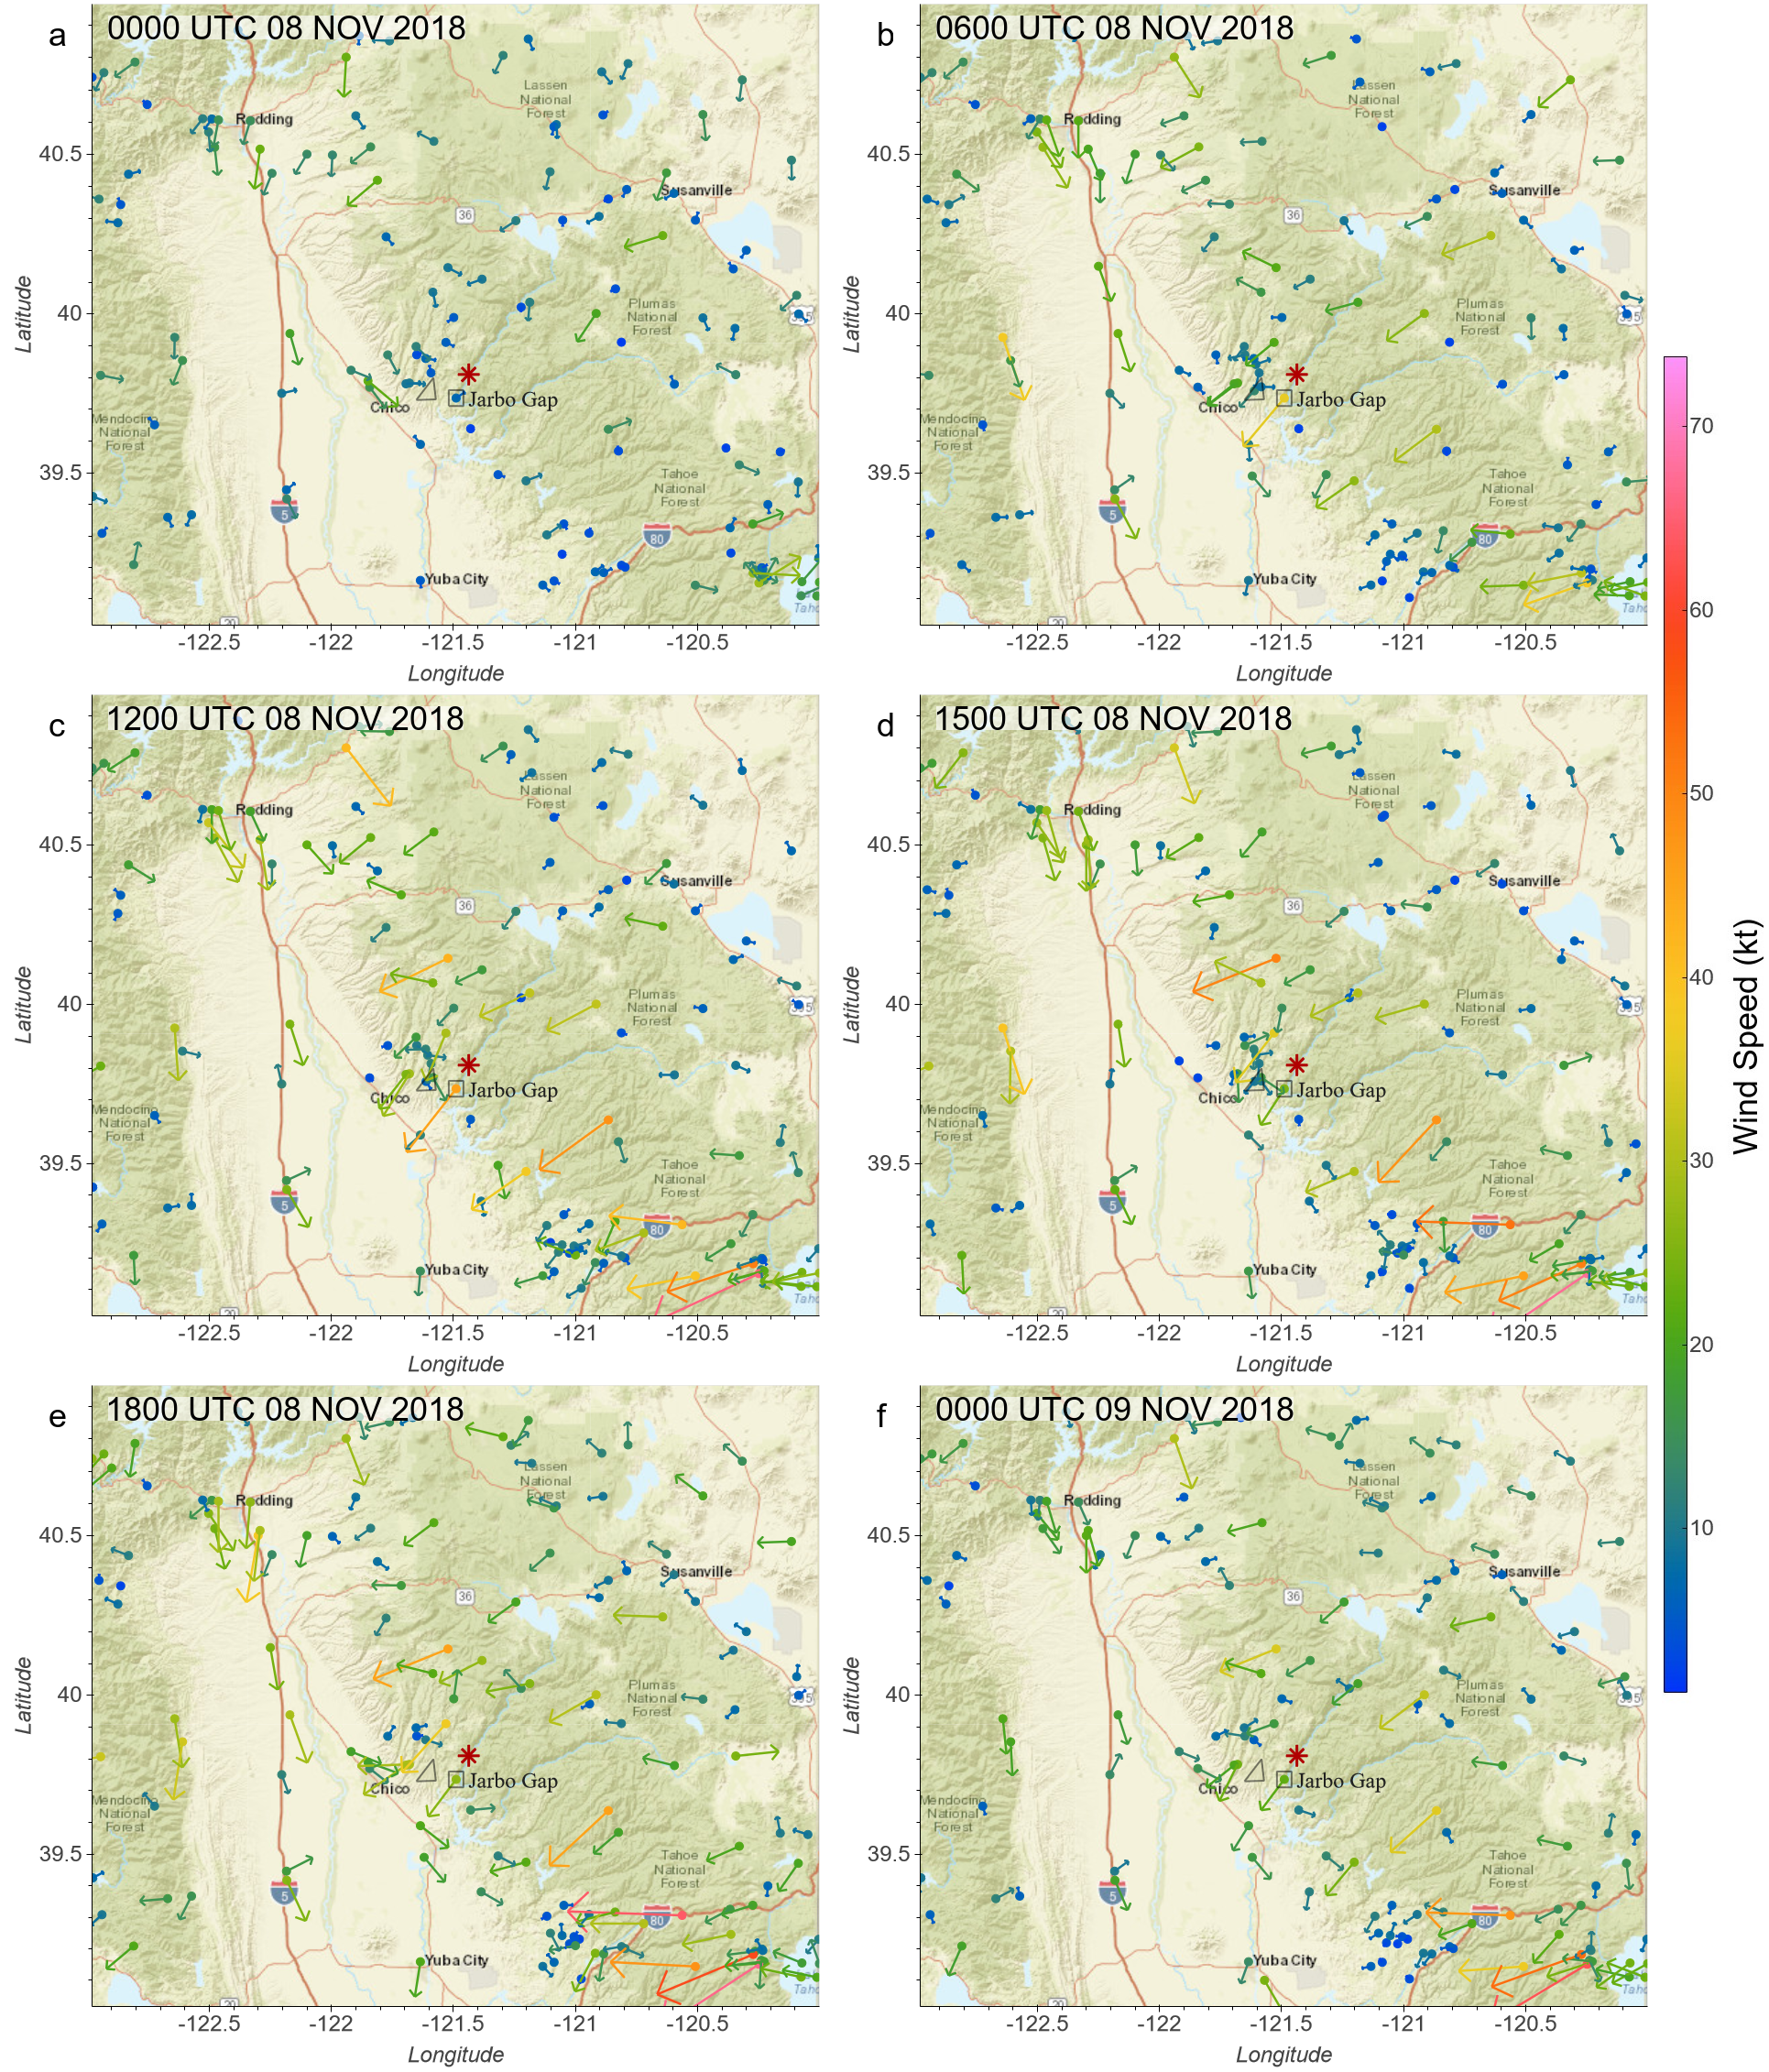
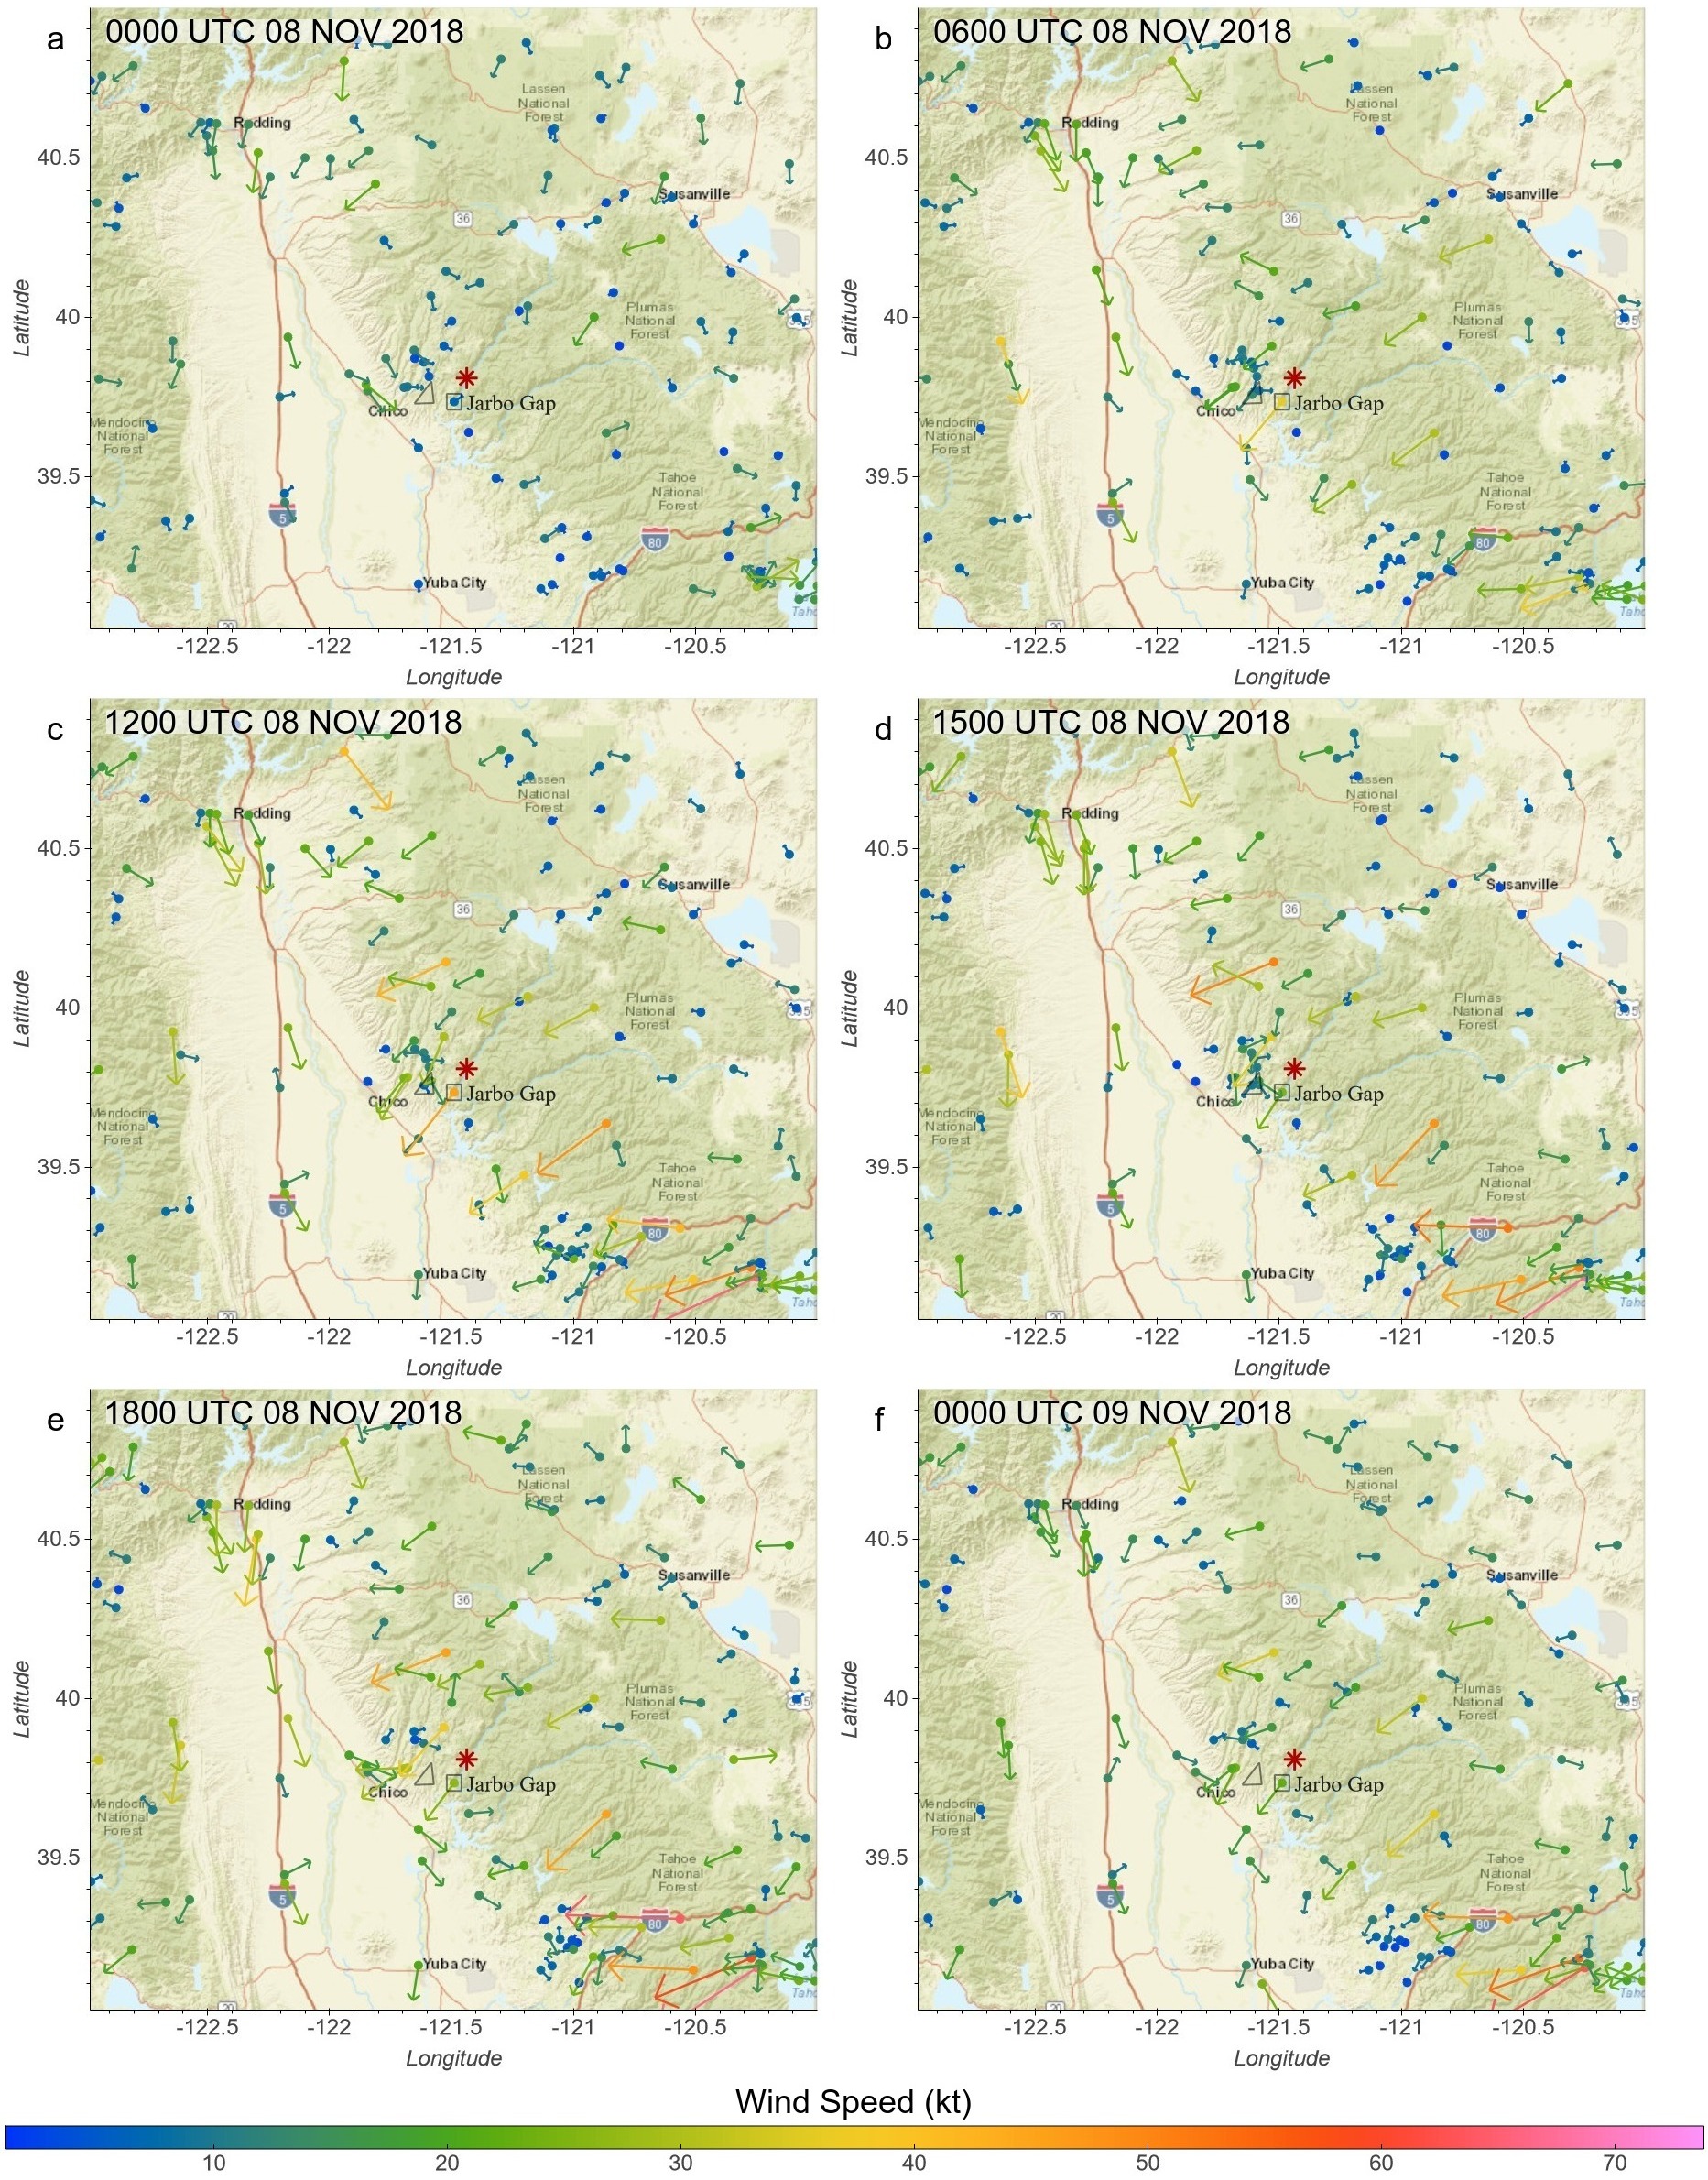
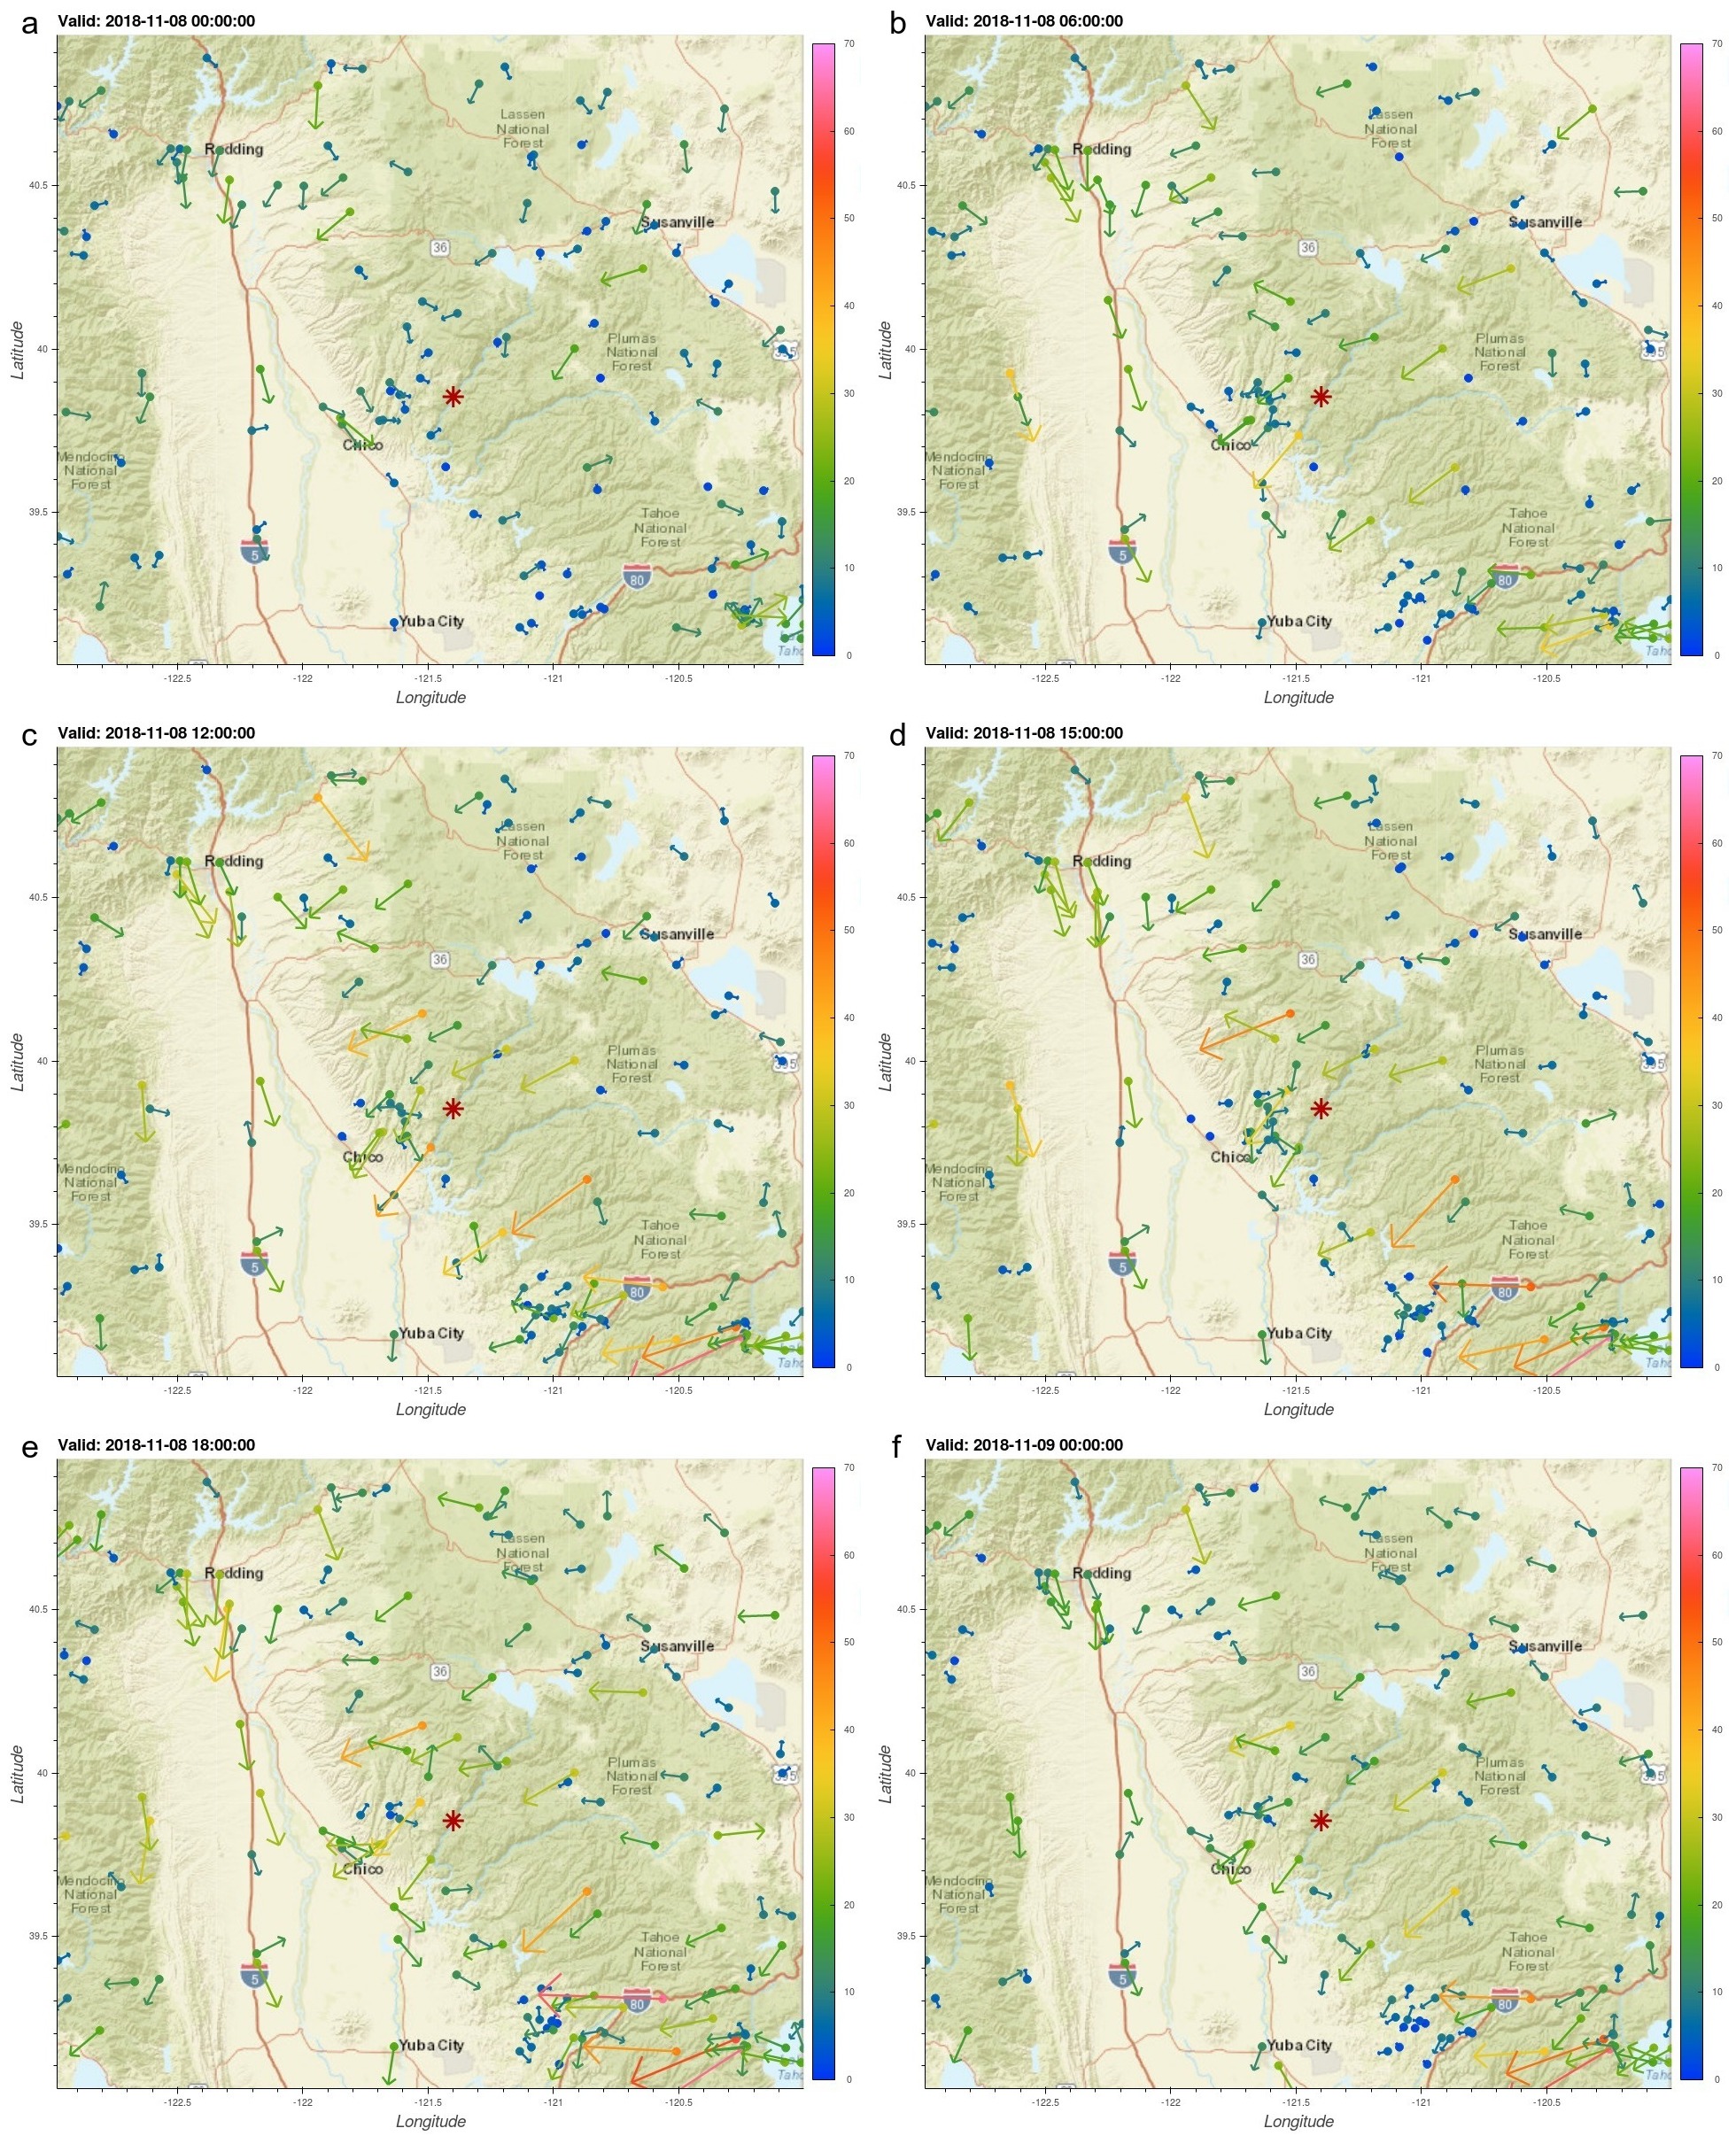
| Fig. 4 Peak gusts for 6 times 8-9 Nov 2018 red asterisk showing
where fire started has only one big color bar at right |
LATEST version
montage_paper_fig10.jpg with Jarbo Gap and Paradise outline montage_paper_fig10old.jpg |
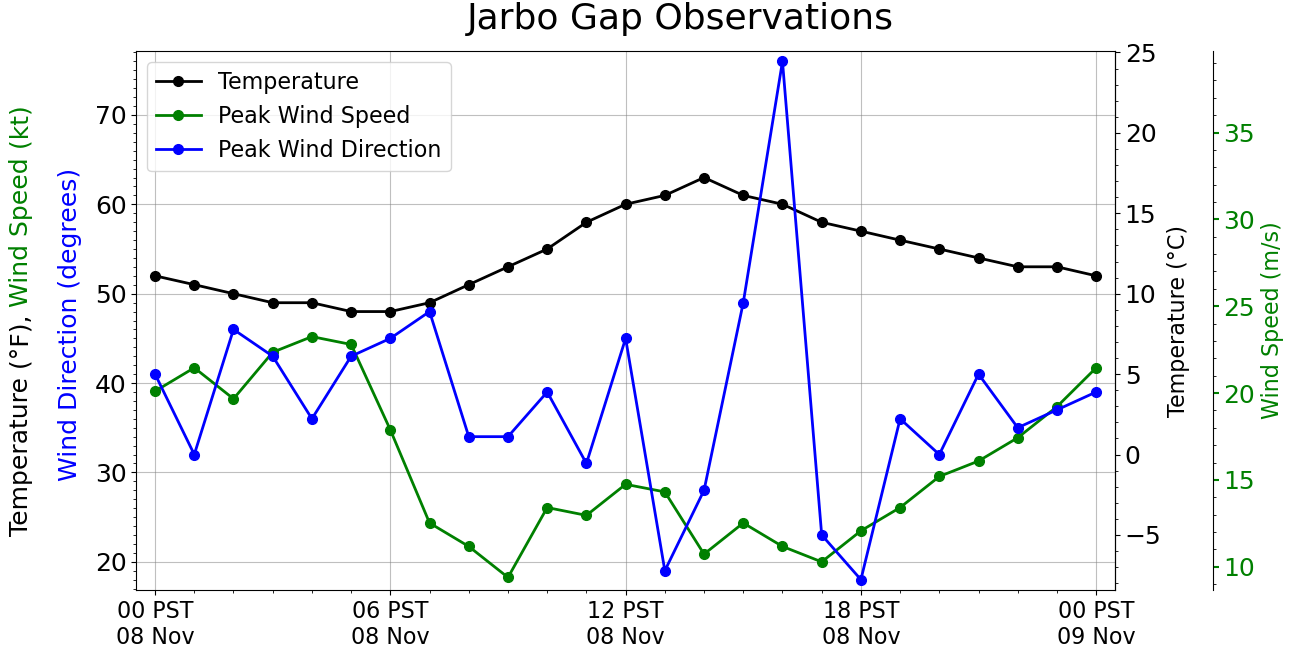
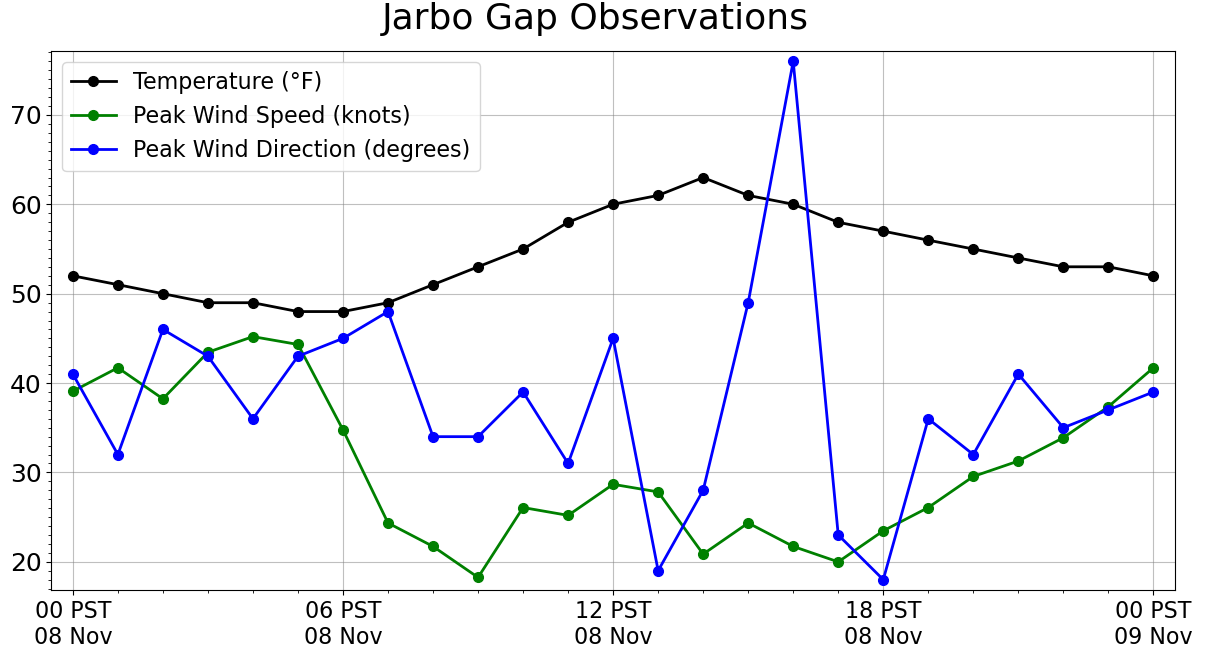
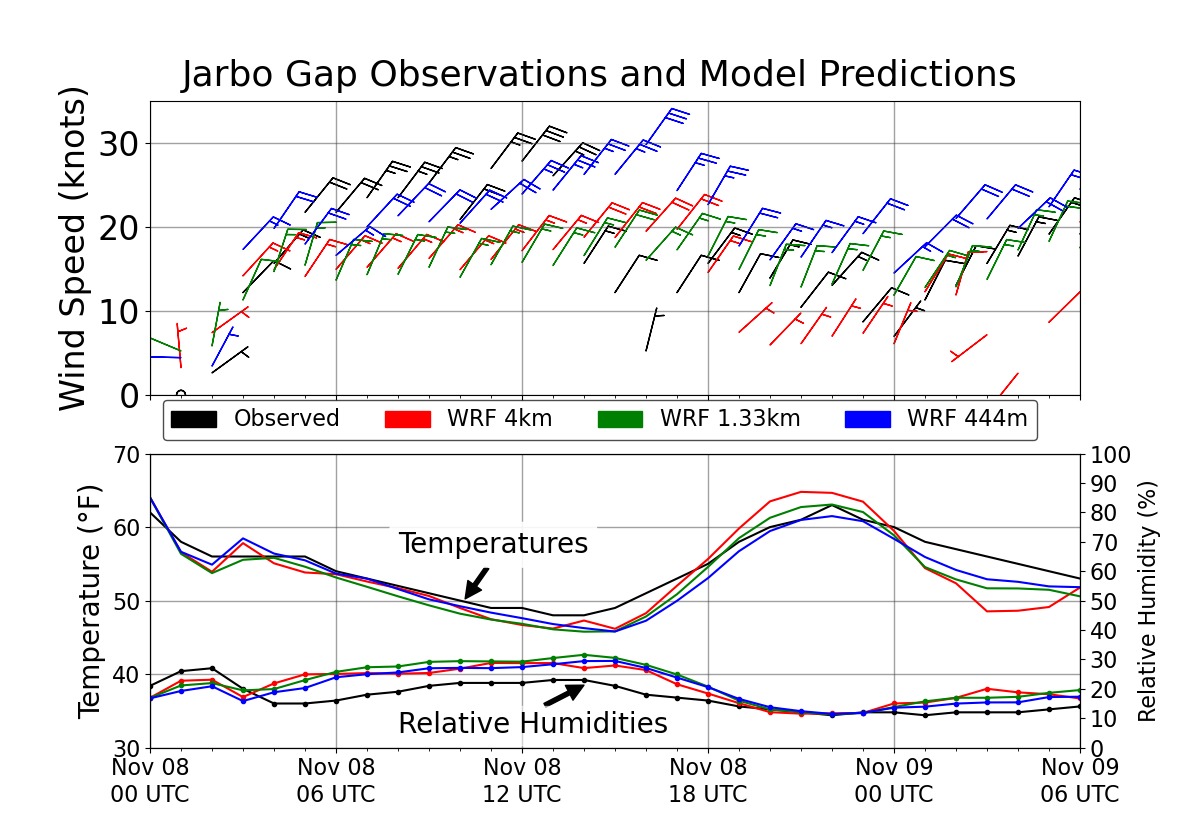
| Fig. 5 one-day time series of Jarbo Gap temperature, peak wind speed and direction |
LATEST version with all units
paper_fig5_temp_winds.final.png |
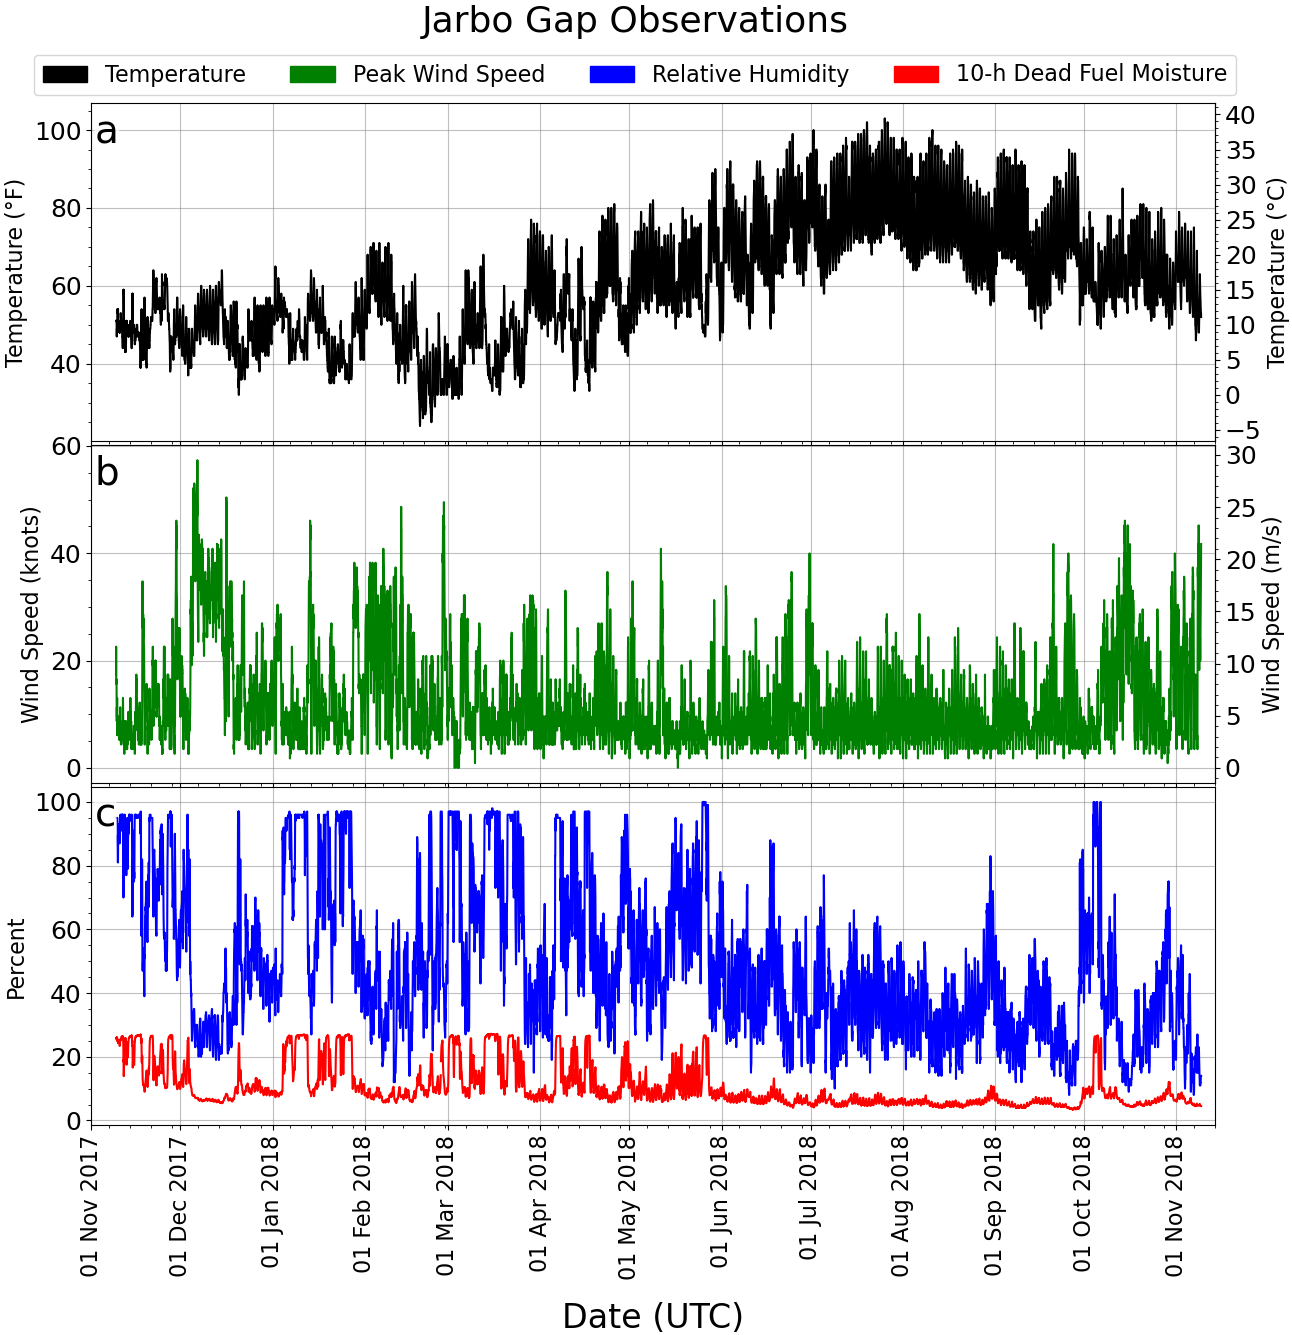
| Fig. 6 one-year time series of Jarbo Gap temperature, peak winds, relative humidity, and 10-h dead fuel moisture | LATEST version paper_fig6_temp_wind_rh_fuel.final.png |
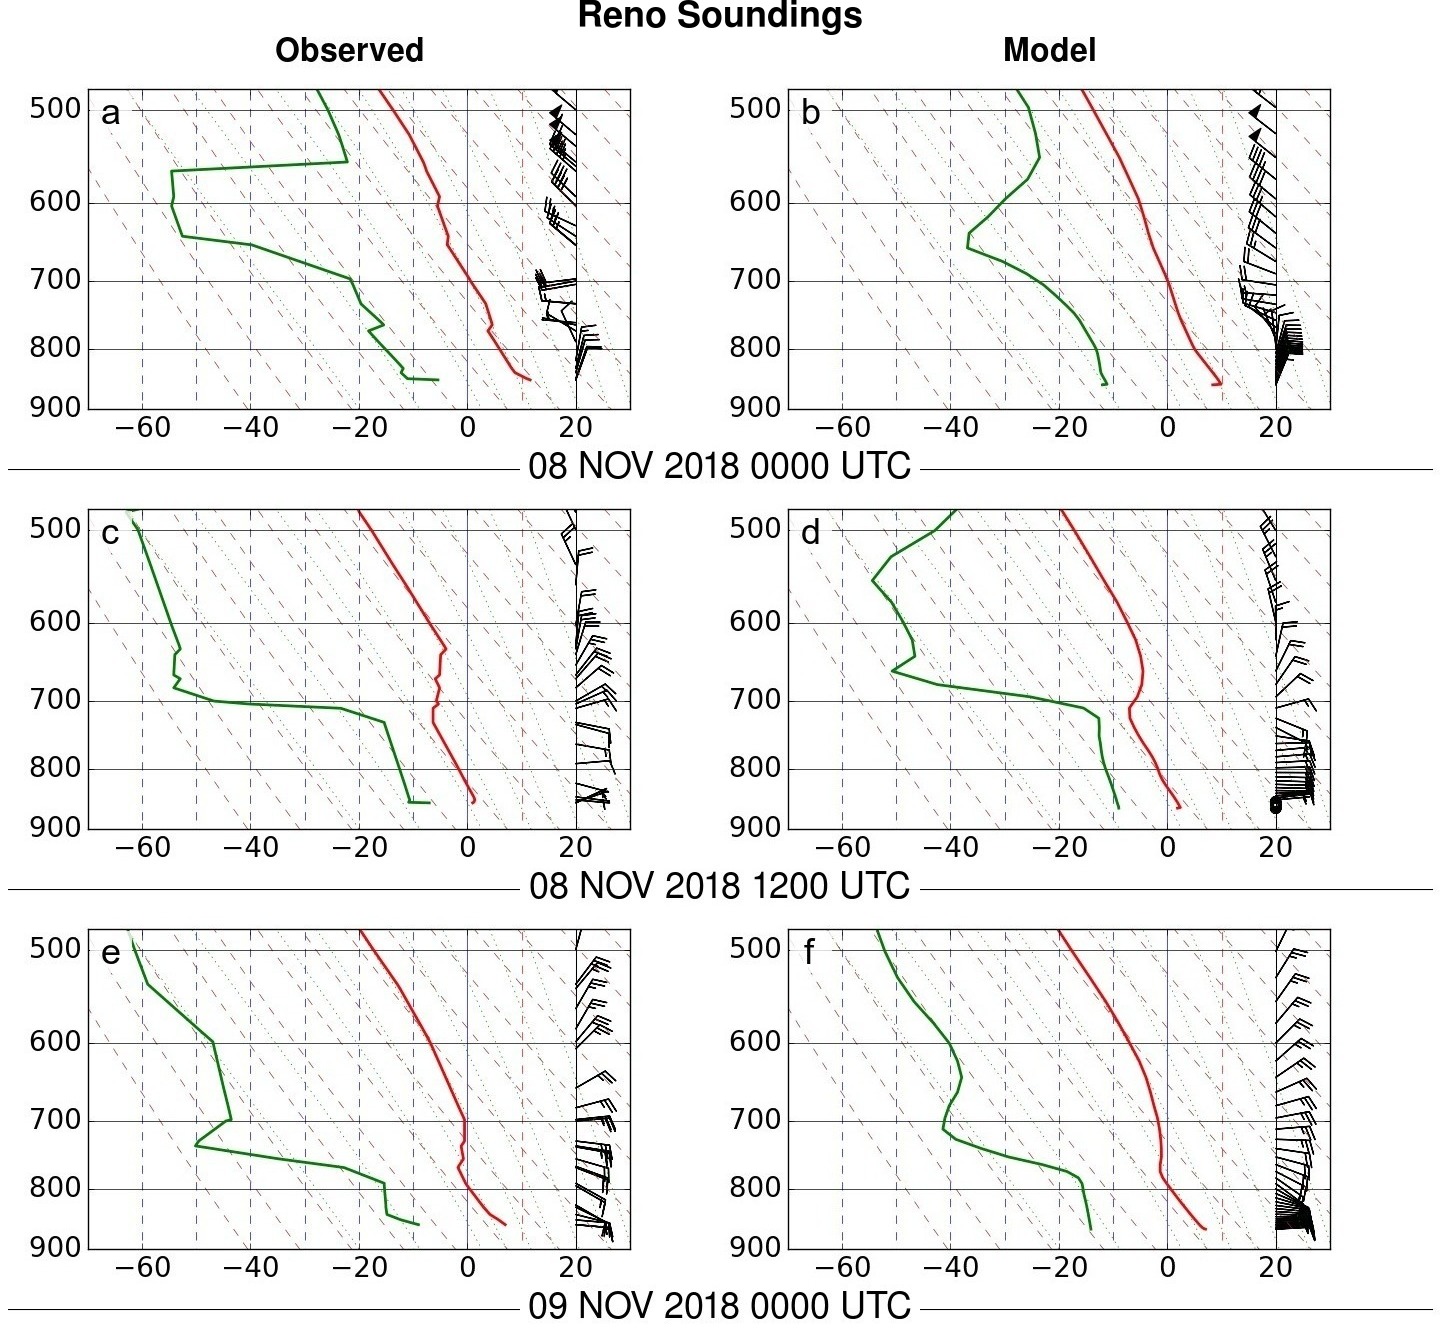
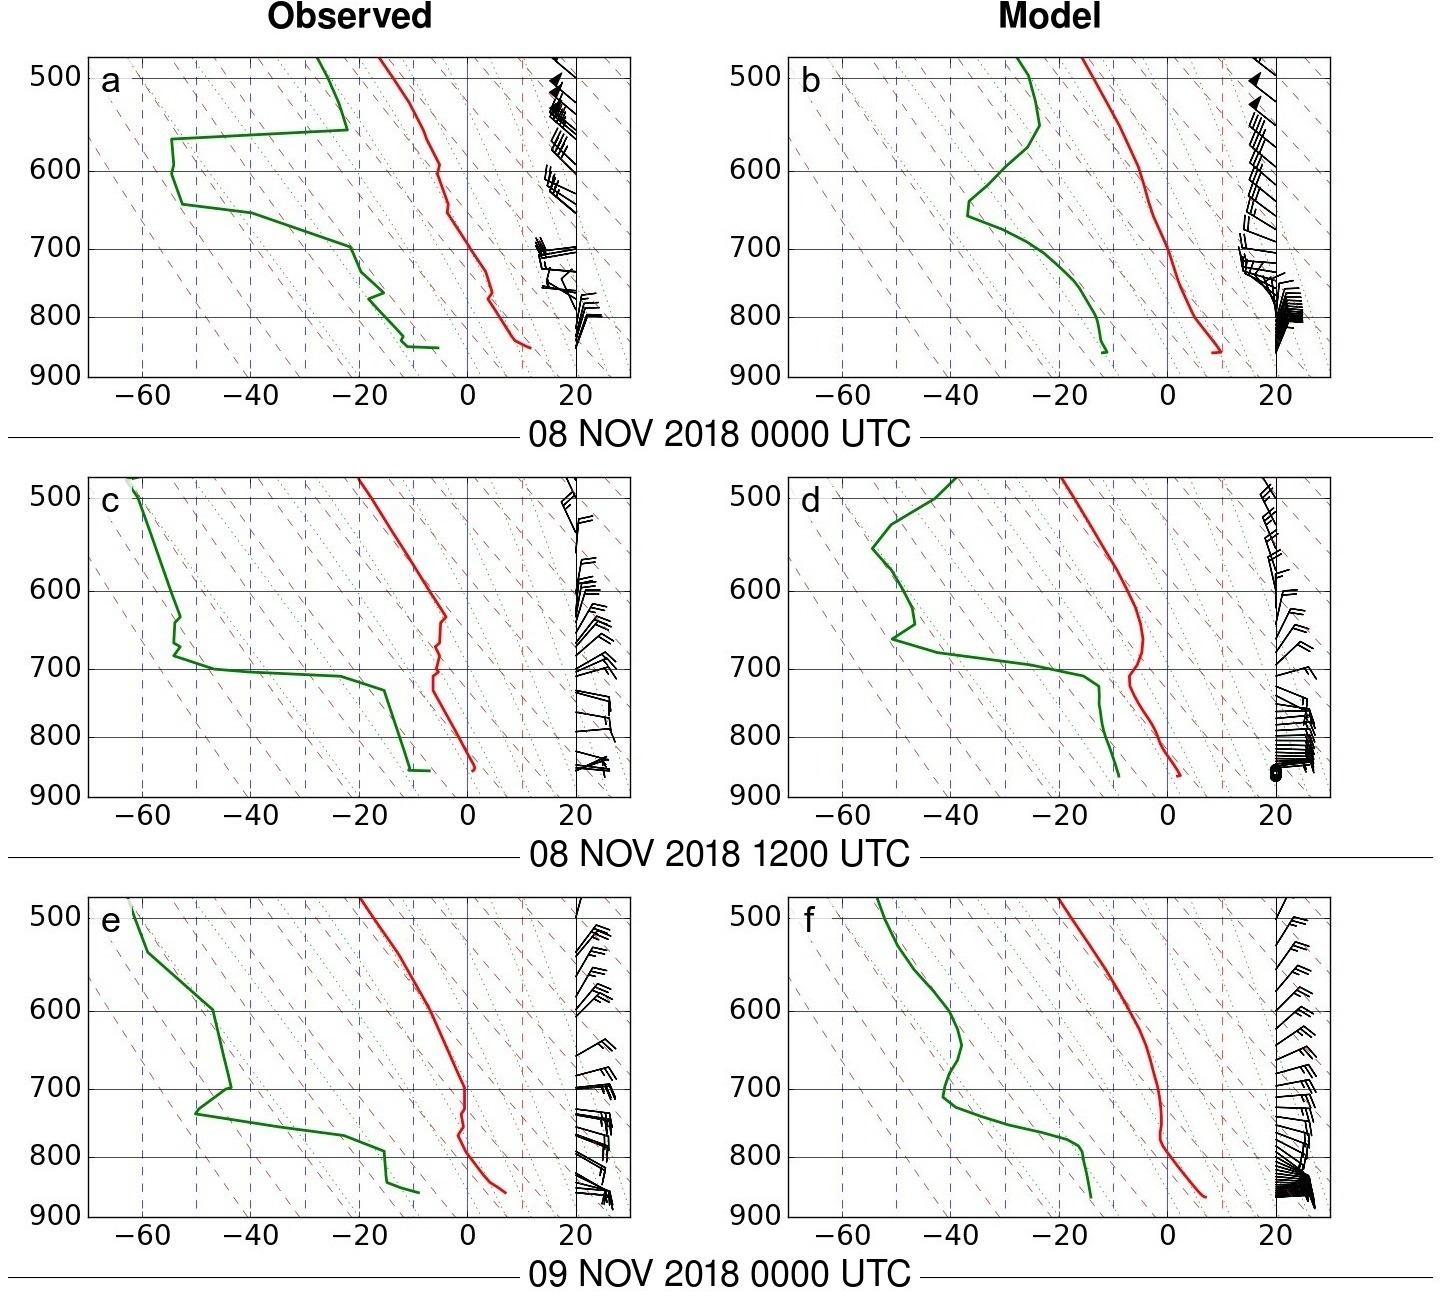
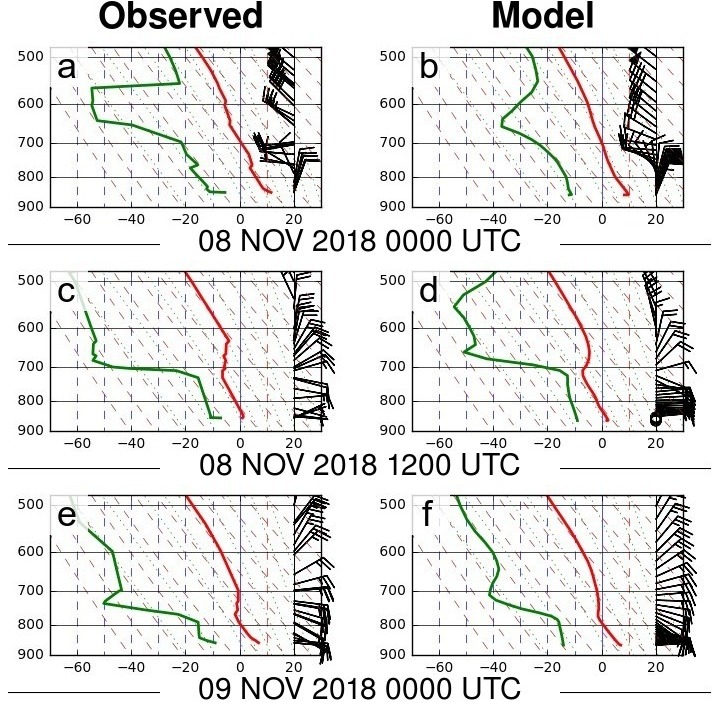
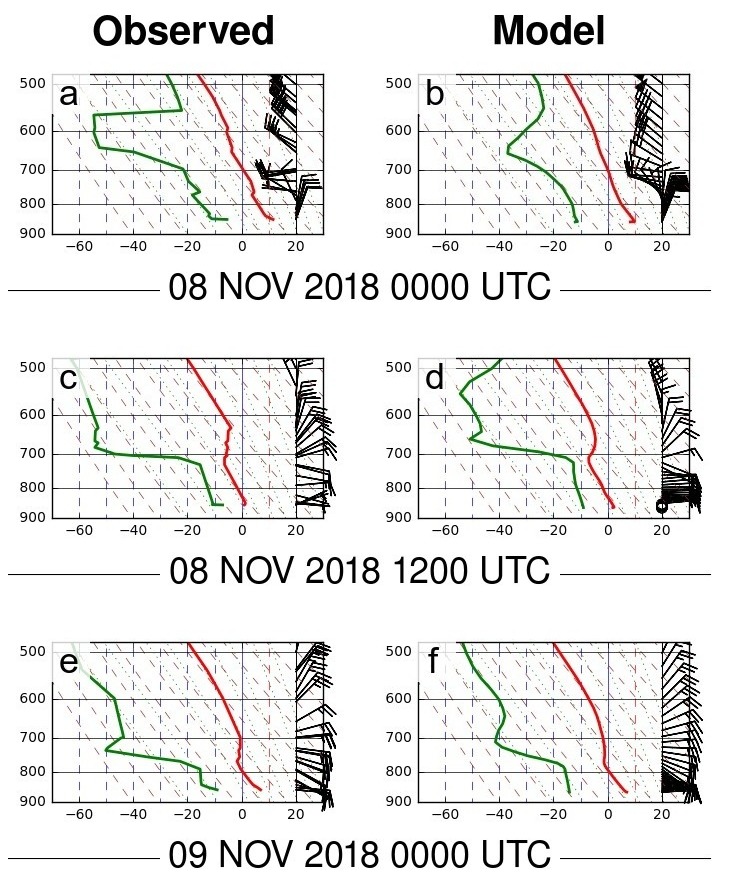
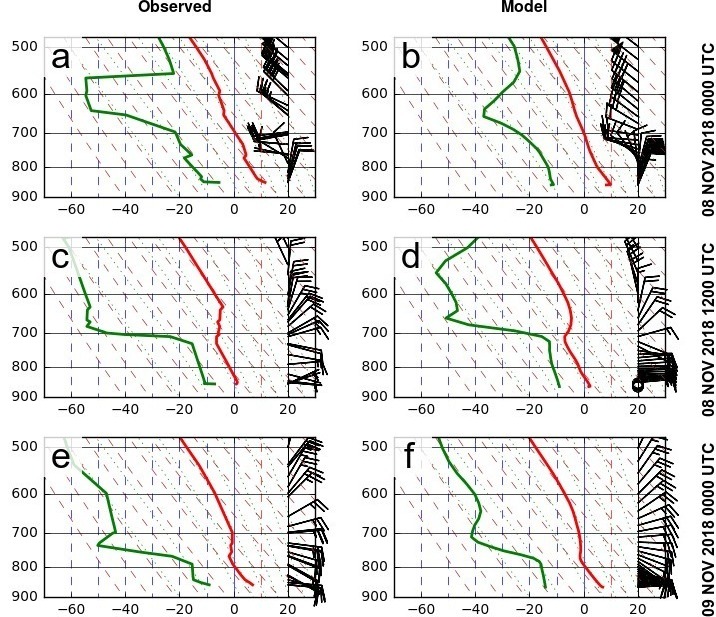
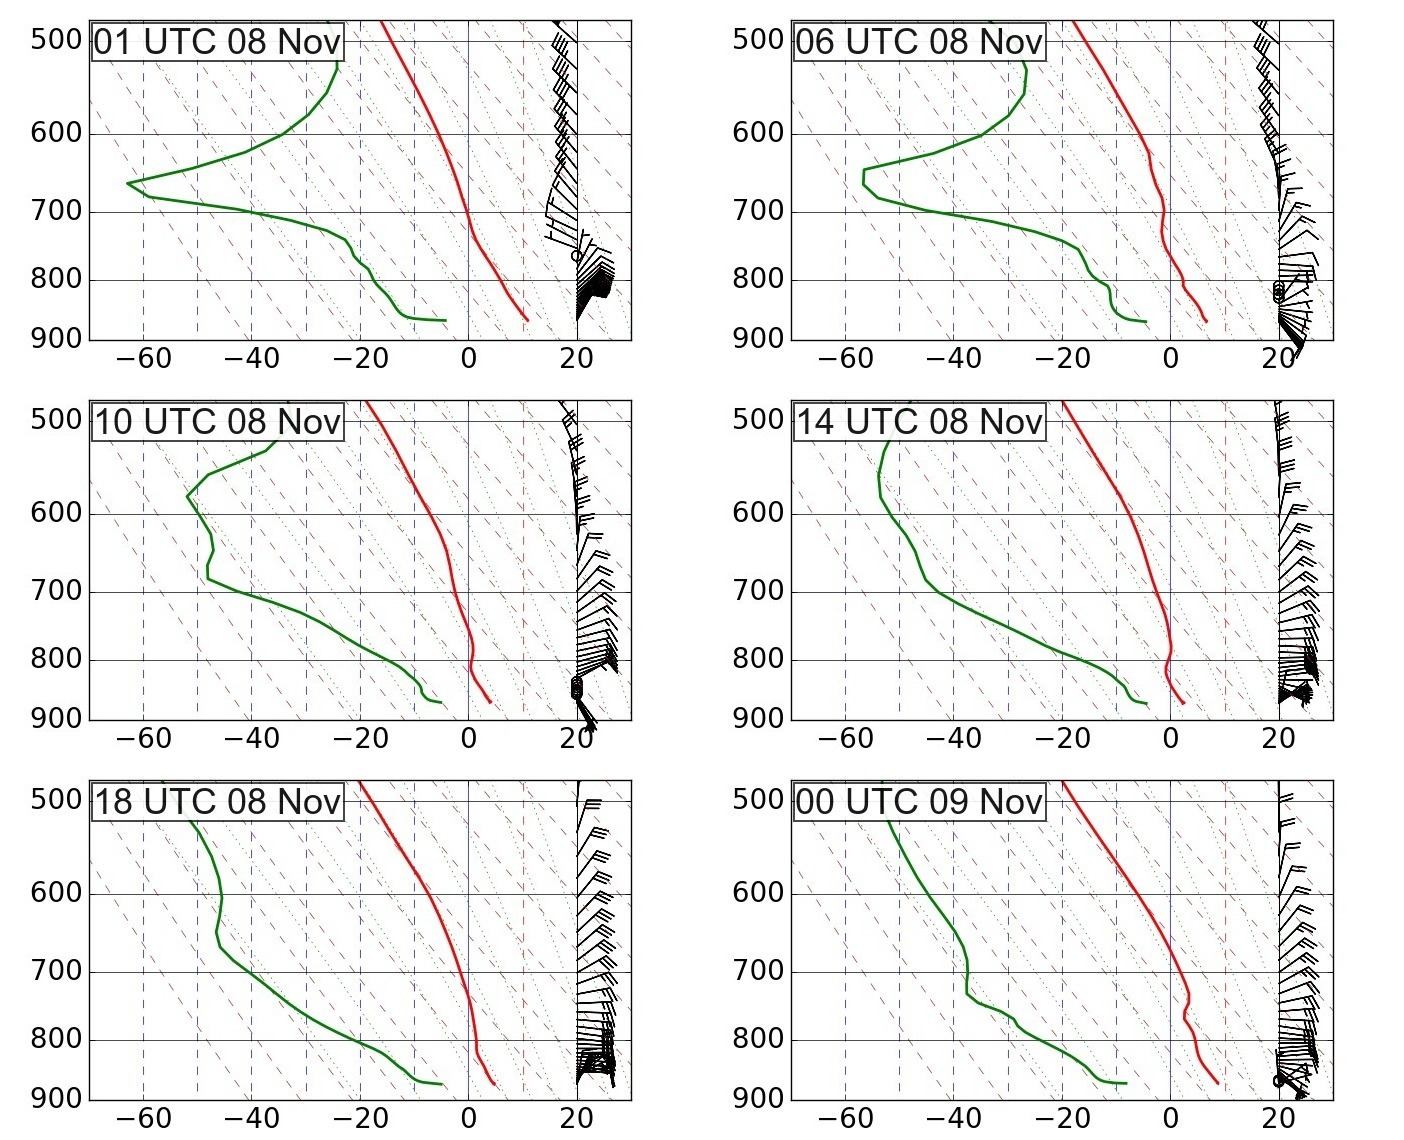
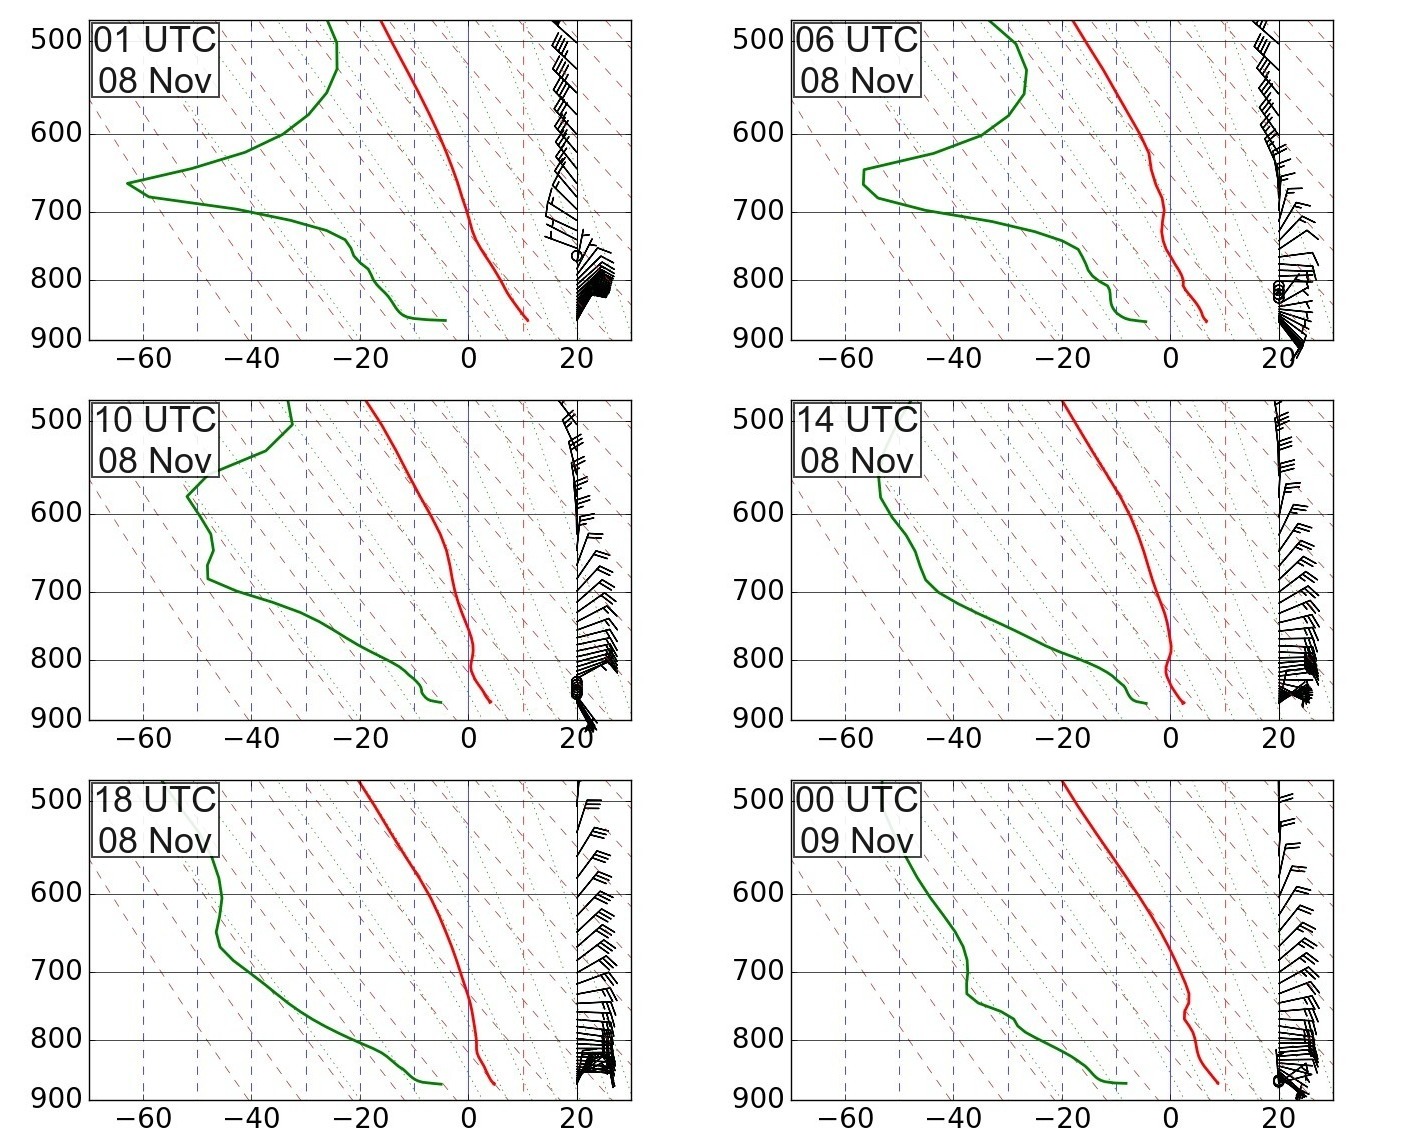
| Fig. 9 6-panel observed and 4/3-km modeled soundings at Reno |
LATEST version
version 2 small loop old big old, too small |
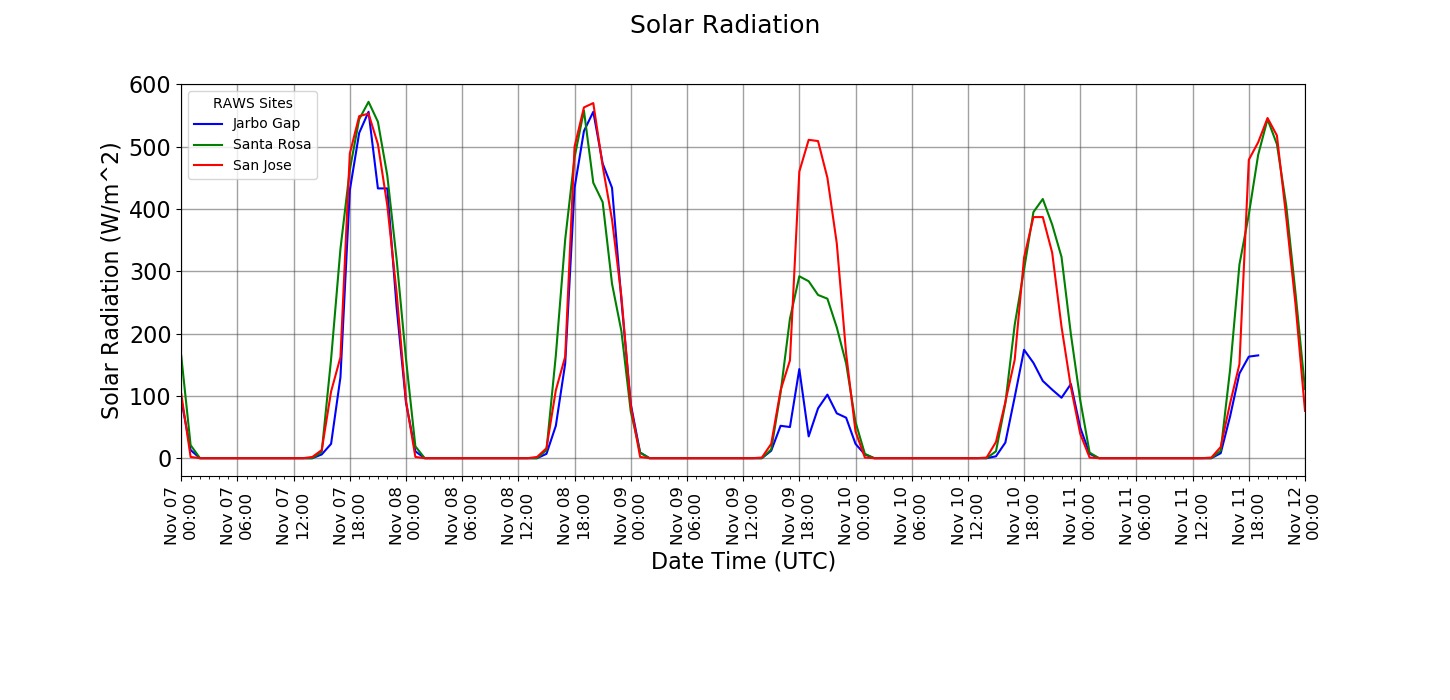
| Fig. 11 Solar radiation time series at Jarbo Gap, Santa Rosa and San Jose RAWS sites | LATEST paper_fig5.jpg |
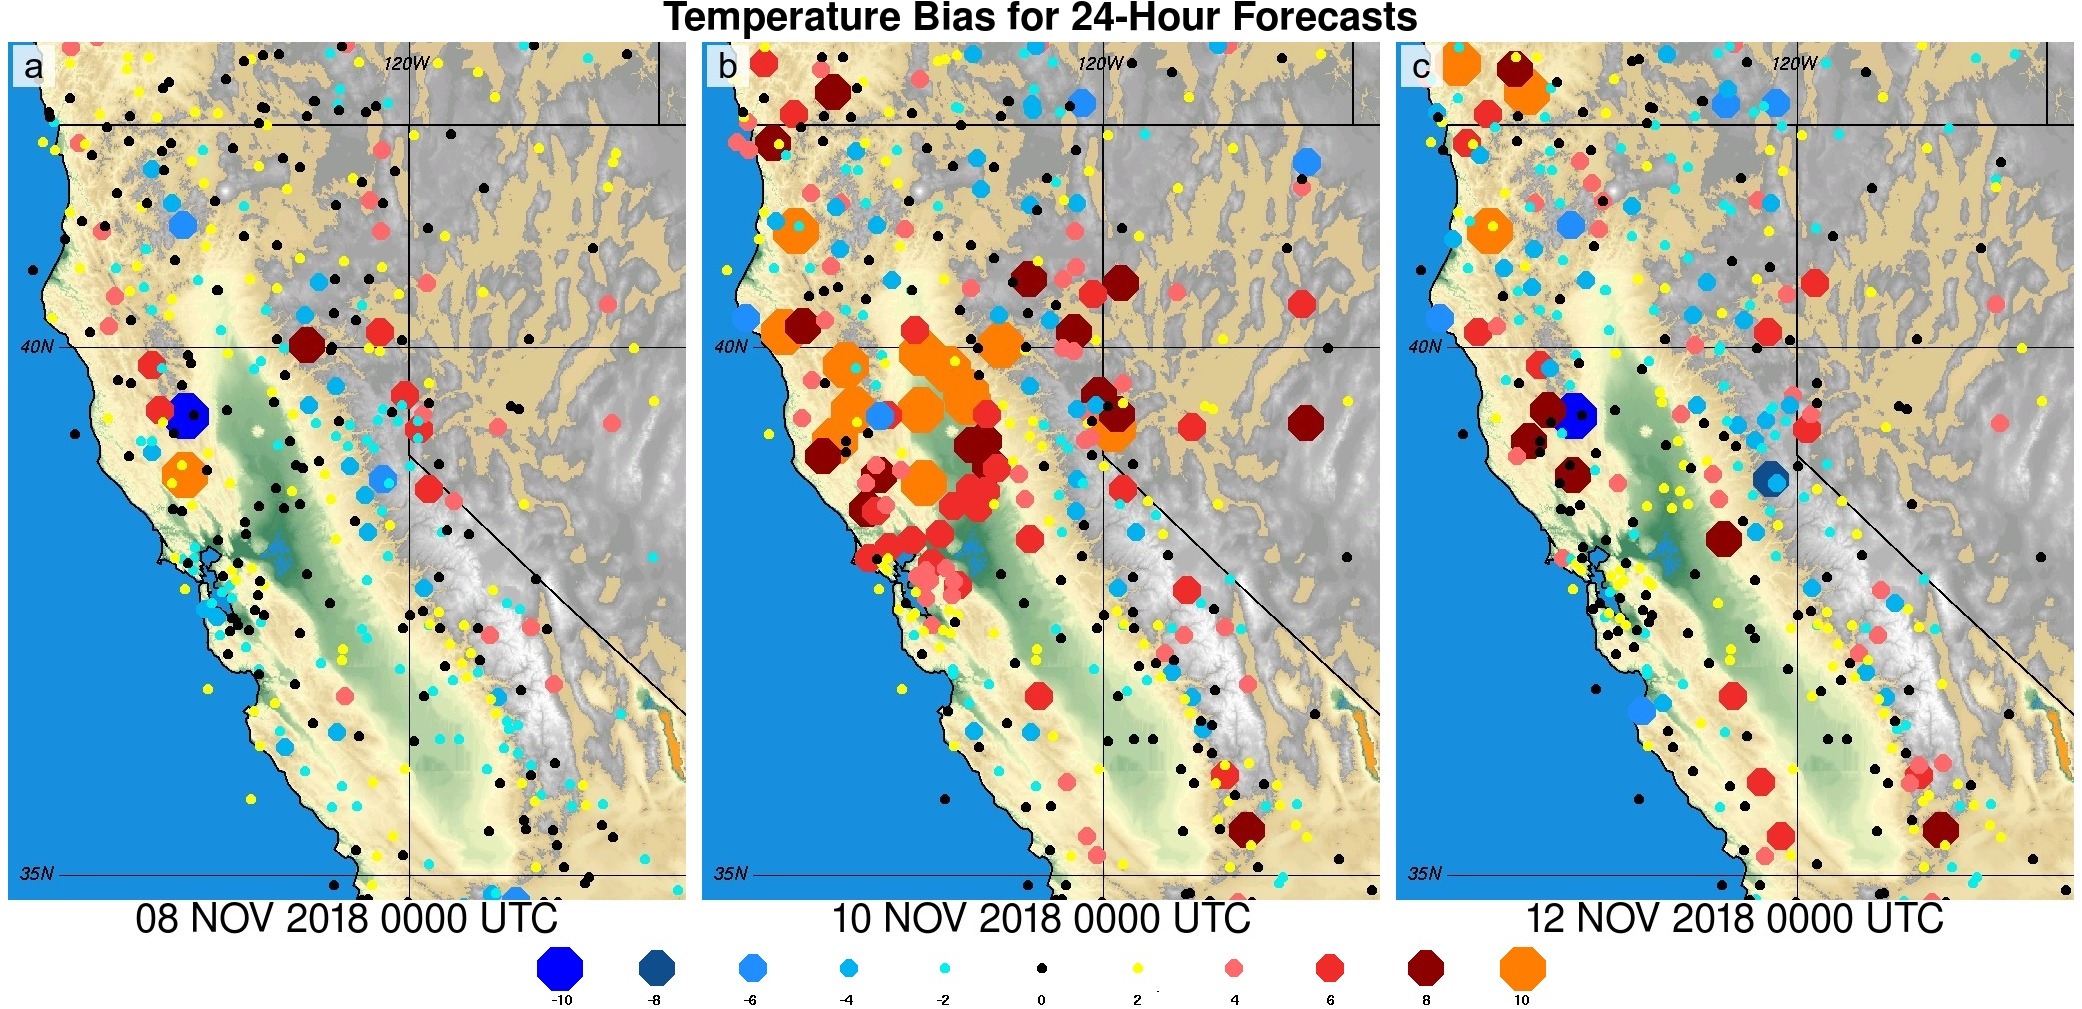
| Fig. 12 Temperature bias (Celsius) 0Z on Nov 8, 10, and 12 2018 | LATEST montage_paper_fig6.jpg |
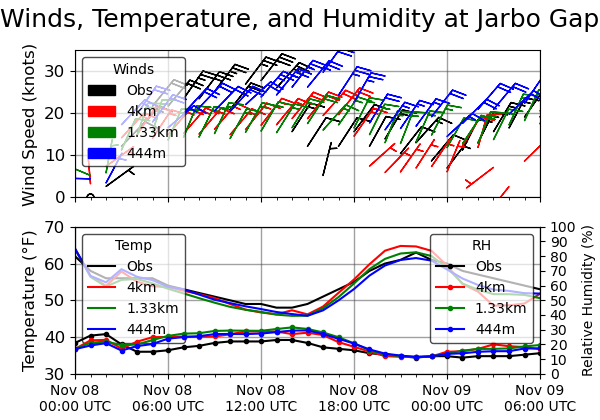
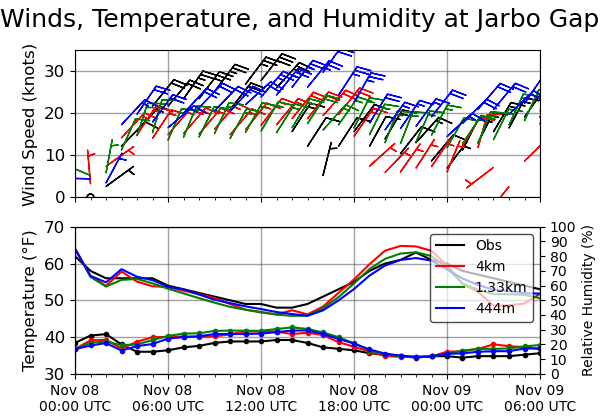
| Fig. 14 2 panel plot of comparing model-predicted and observed winds, temperature, and relative humidity at Jarbo Gap |
LATEST, final version
small version small version 1 legend loop |
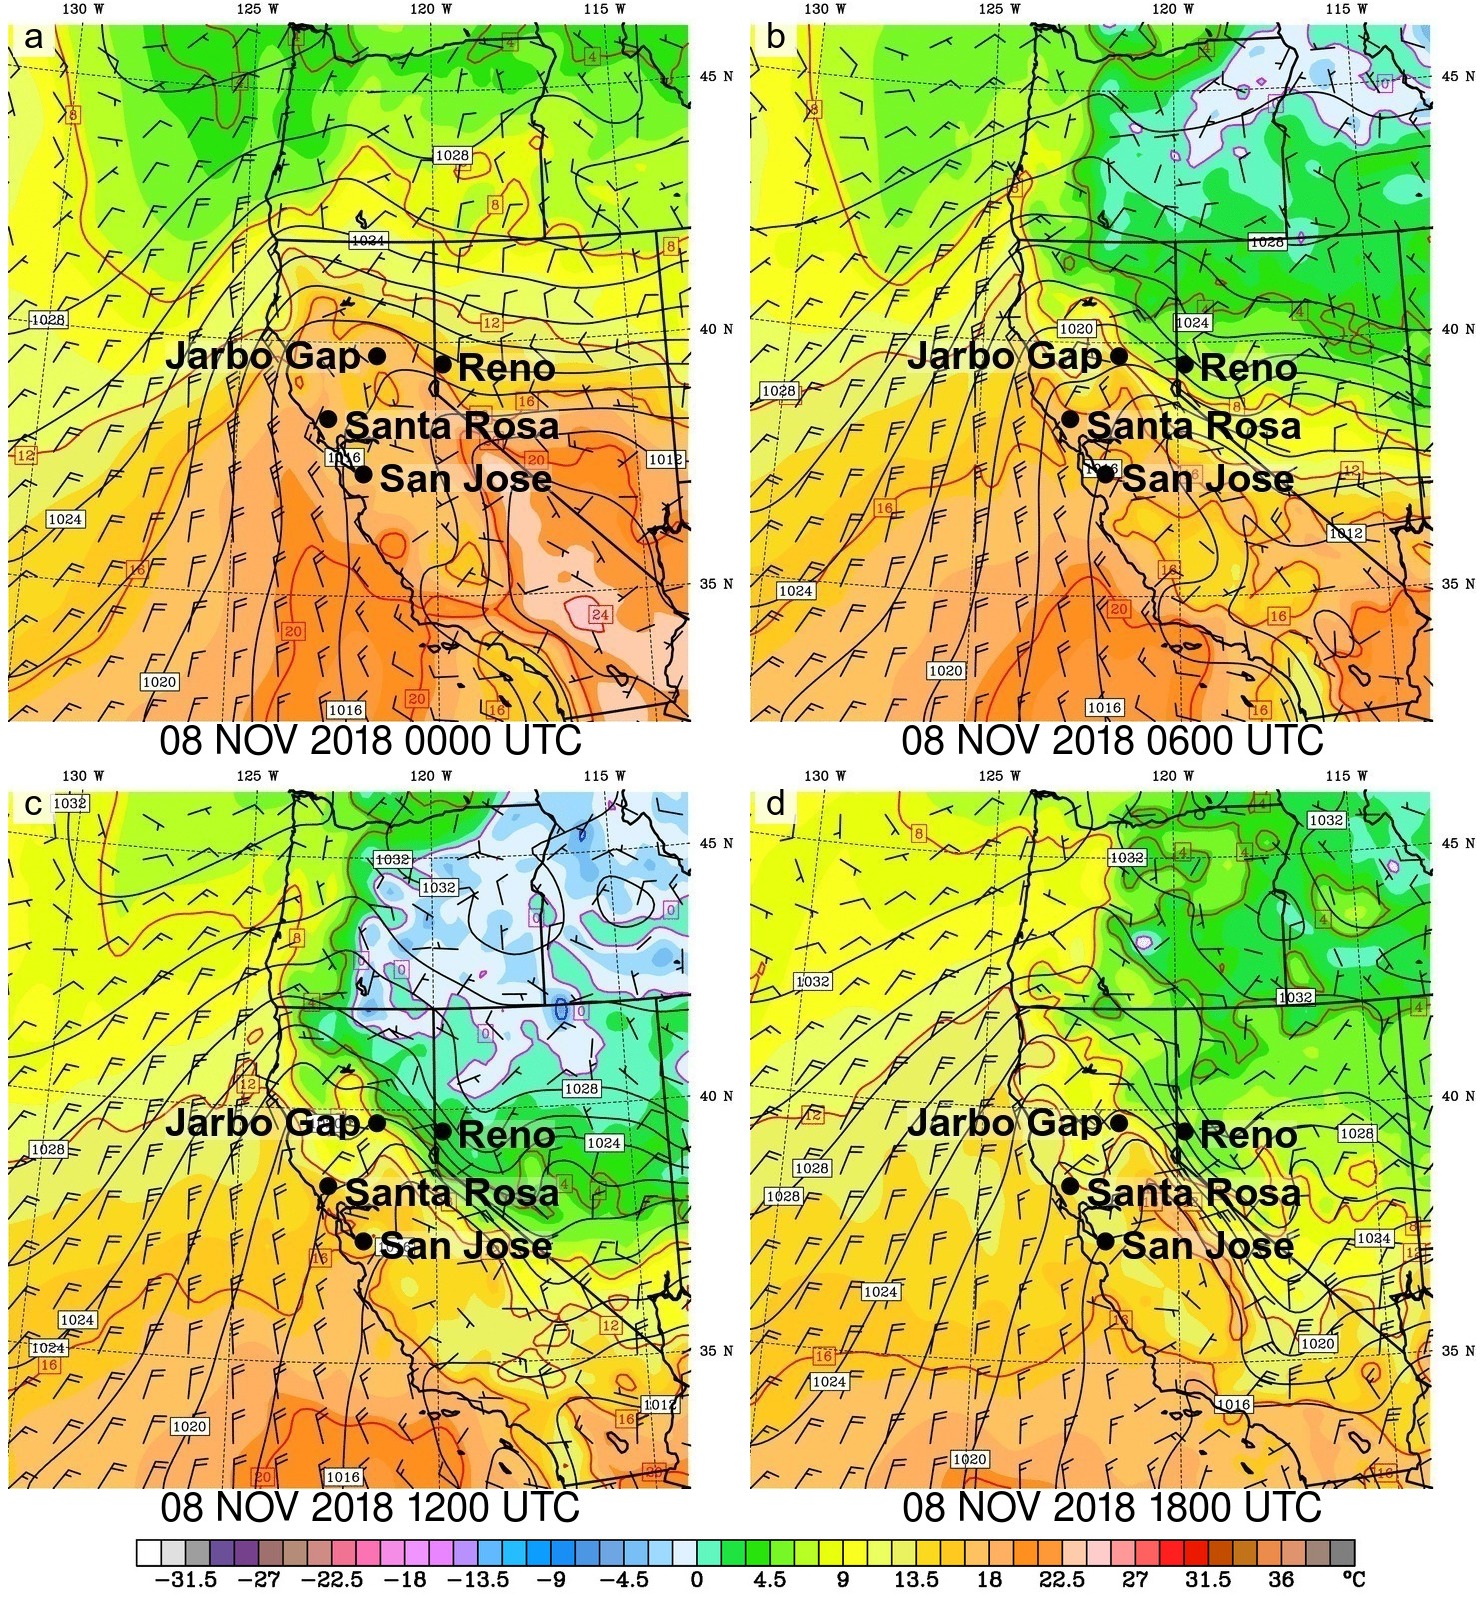
| Fig. 15 4-panel 12-km modeled 925 temps, SLP, and 10m winds |
LATEST now showing RAWS sites and Reno
loop with old version |
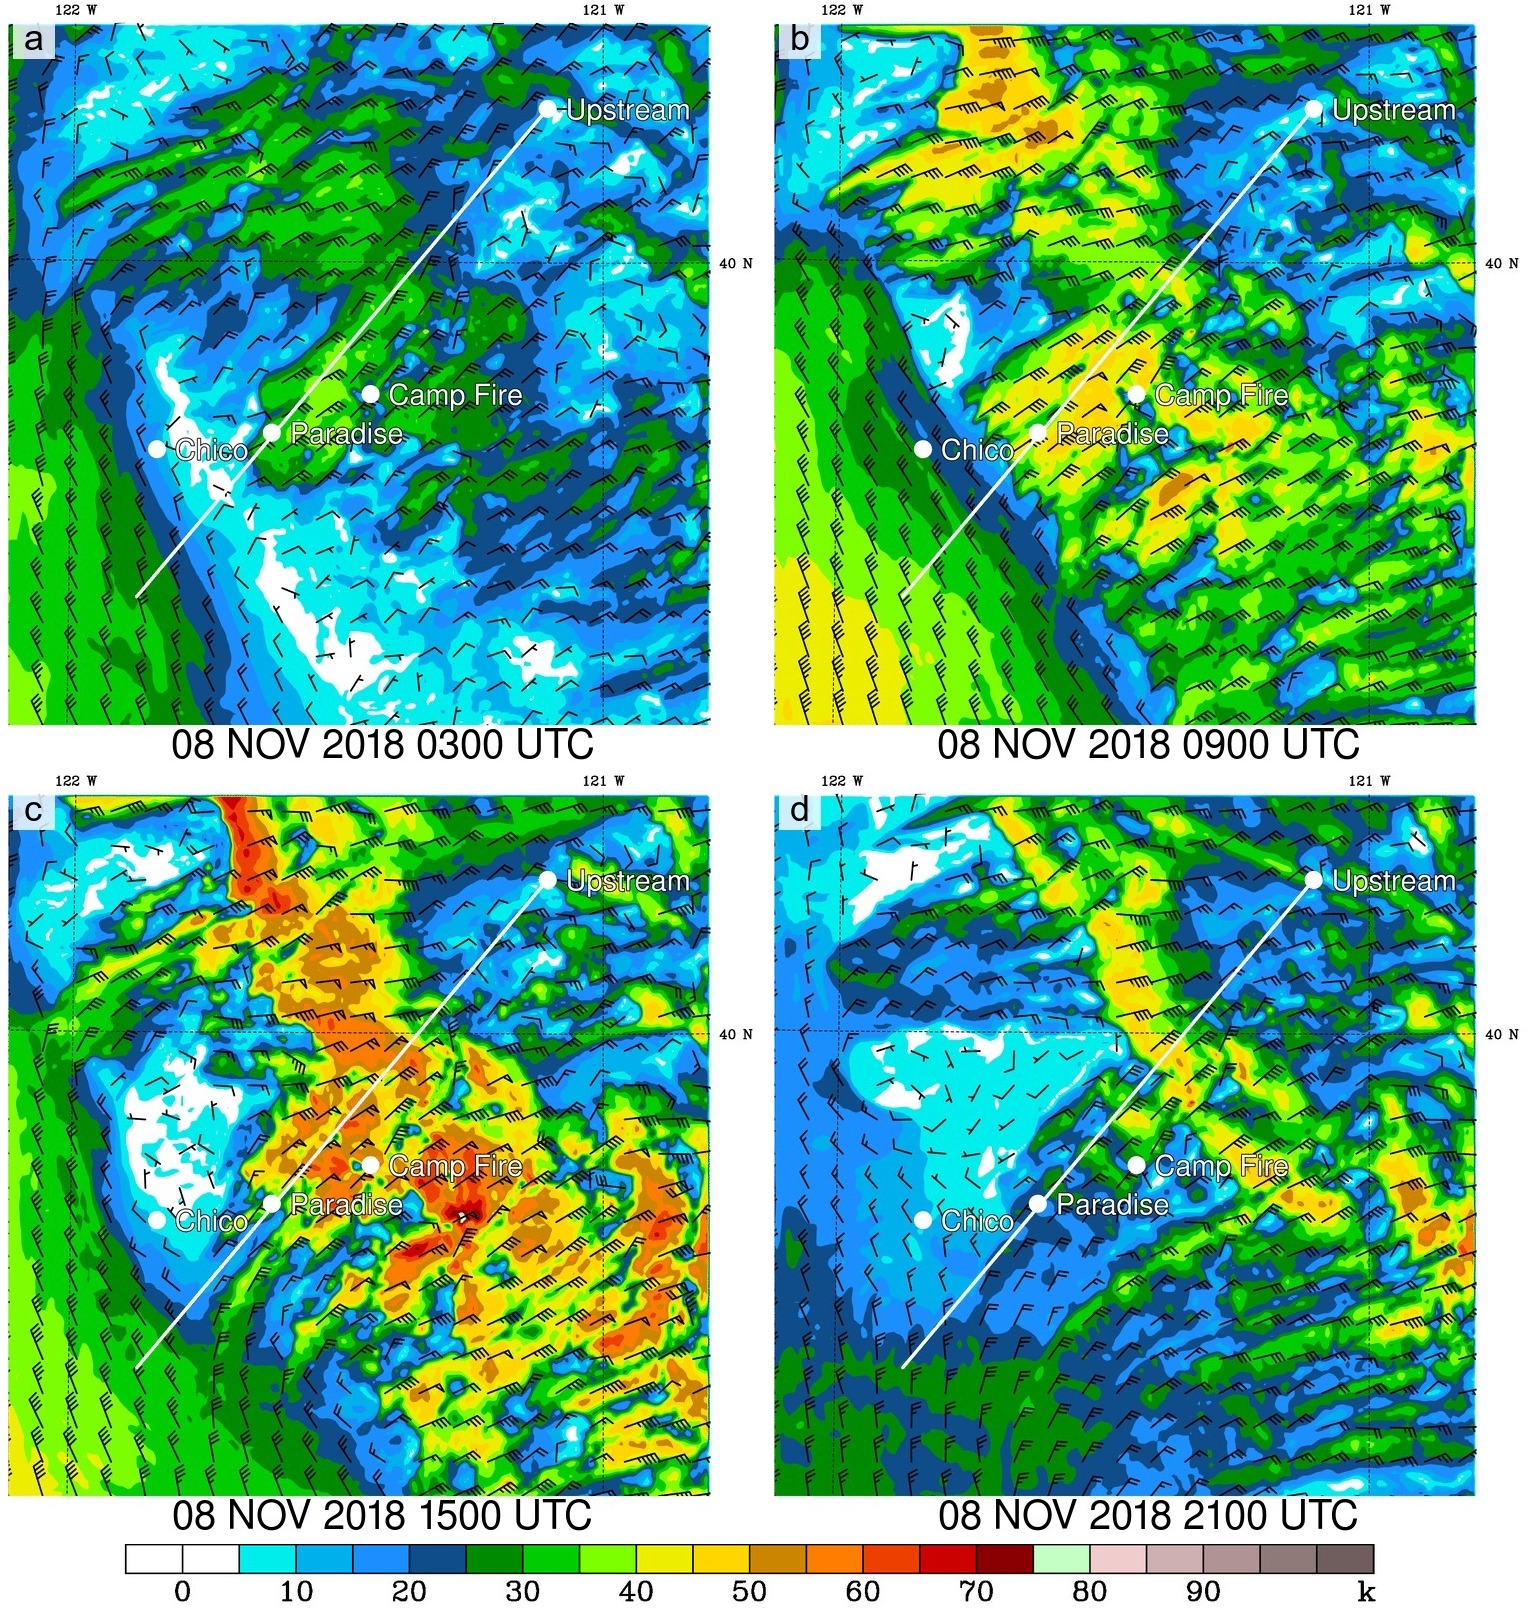
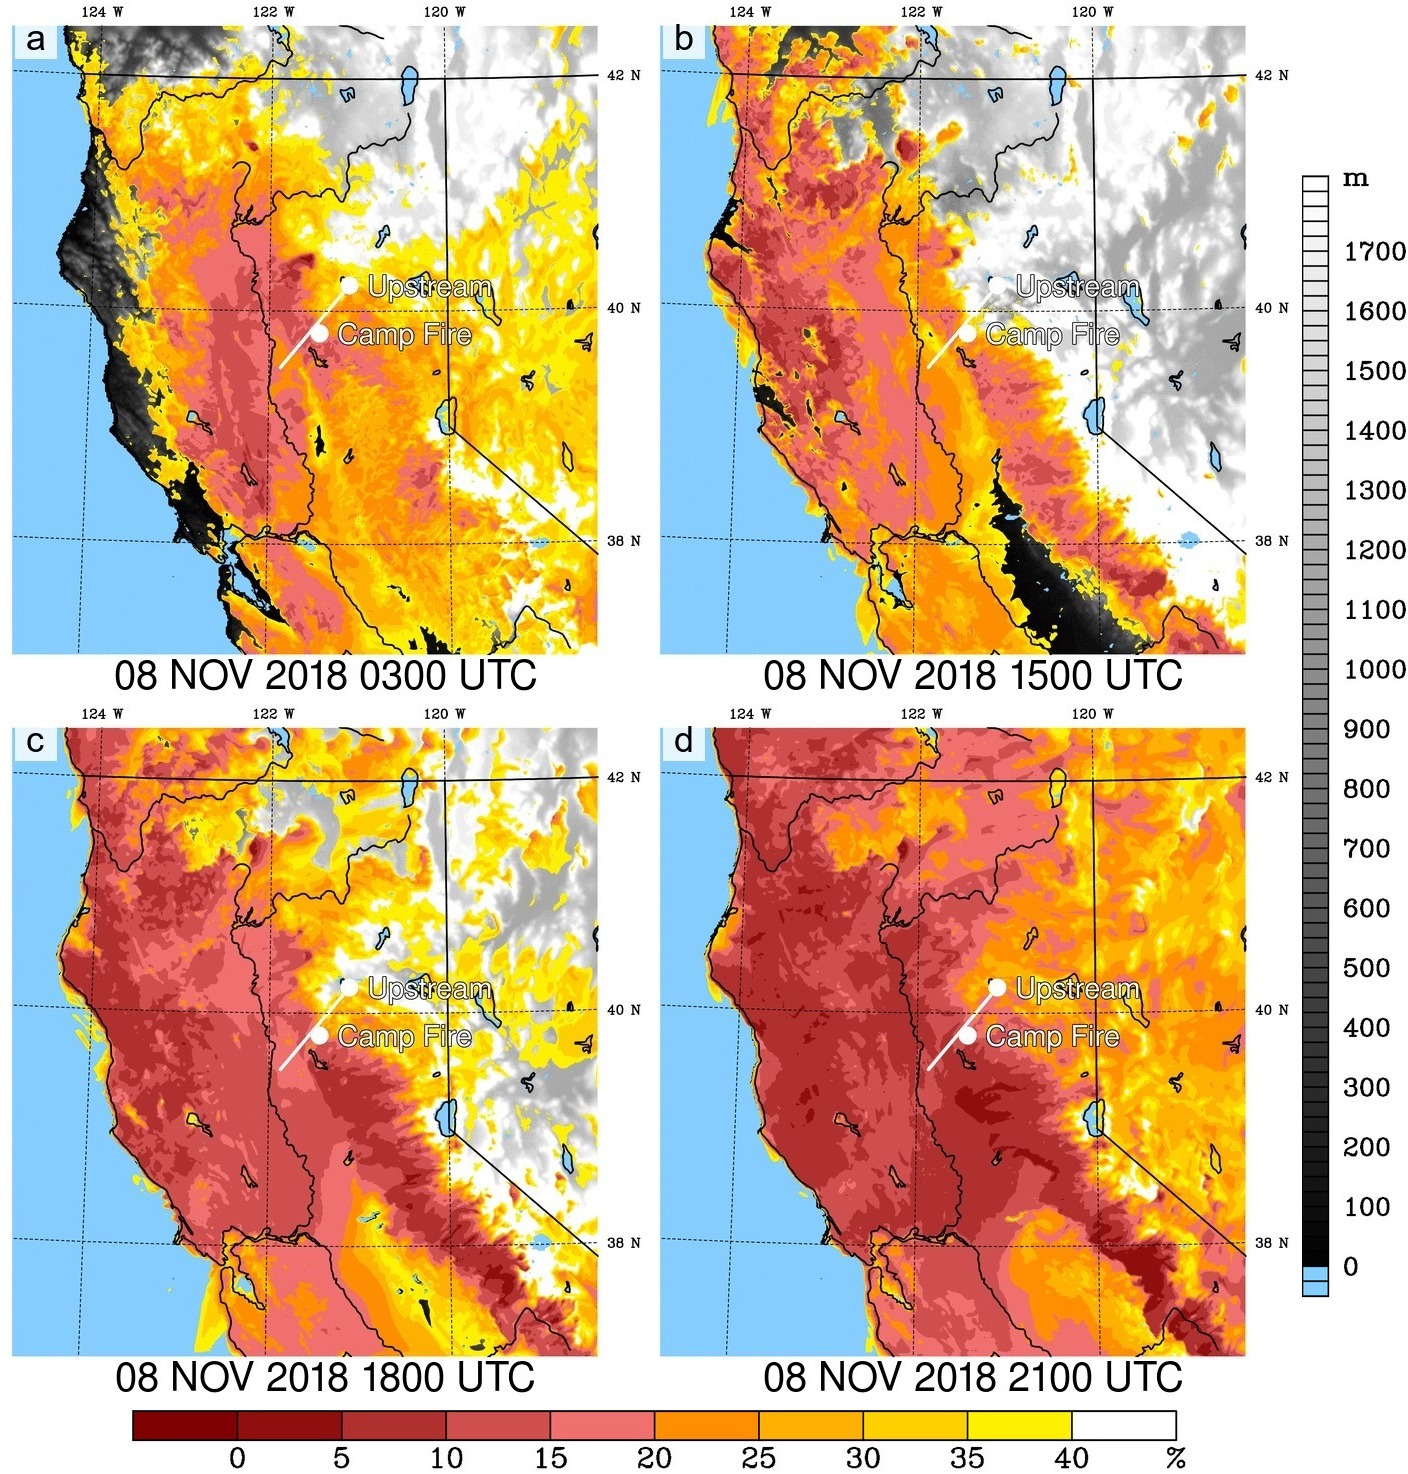
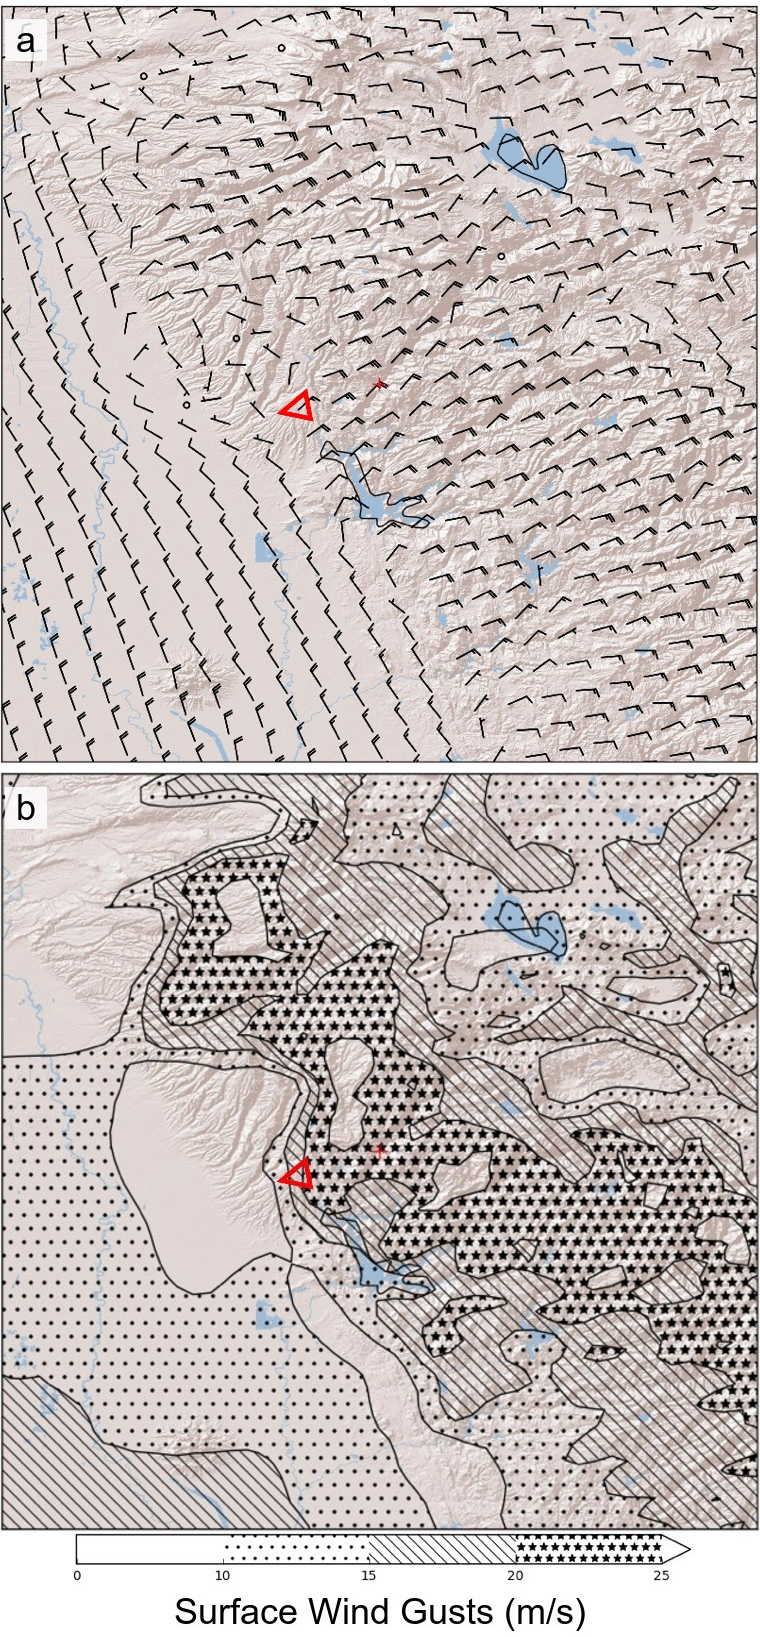
| Fig. 16 4-panel 444m modeled Max winds within 250m AGL also has cross section location, and upstream sounding location | LATEST |
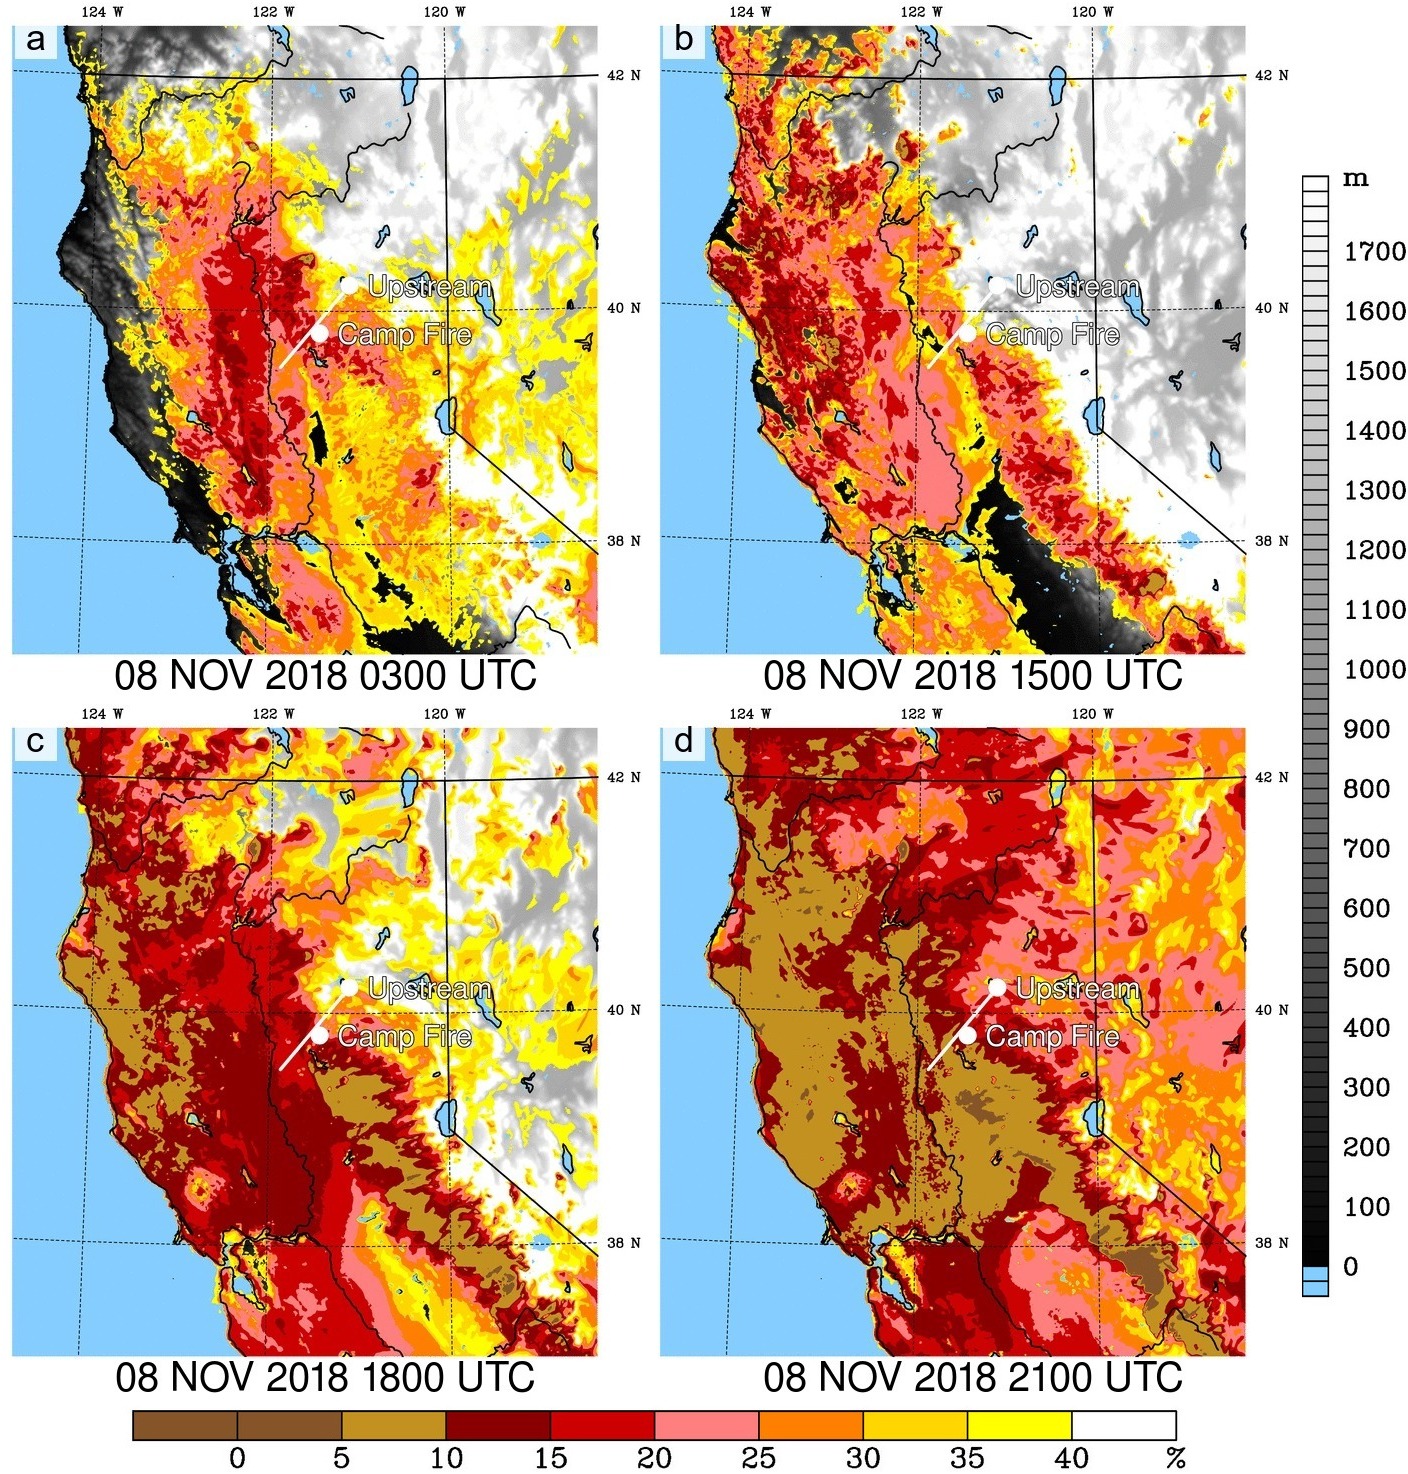
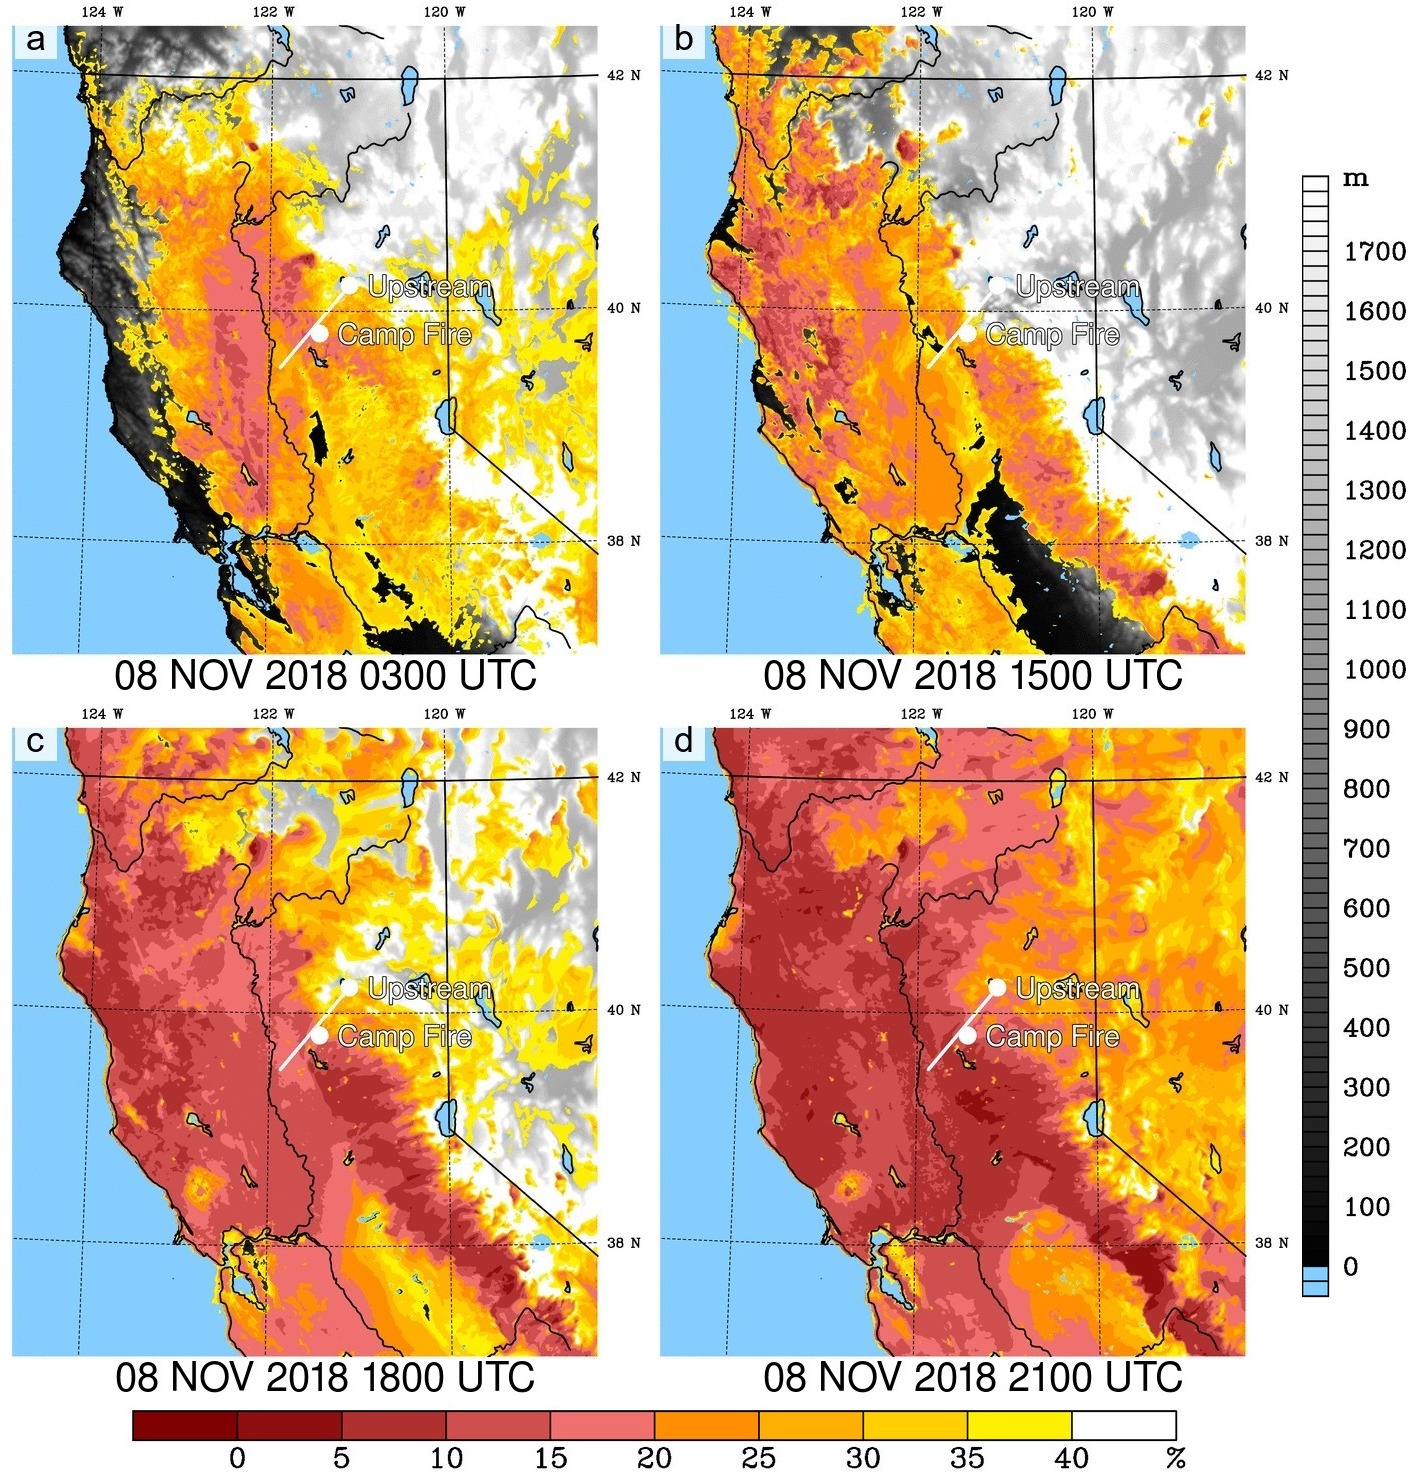
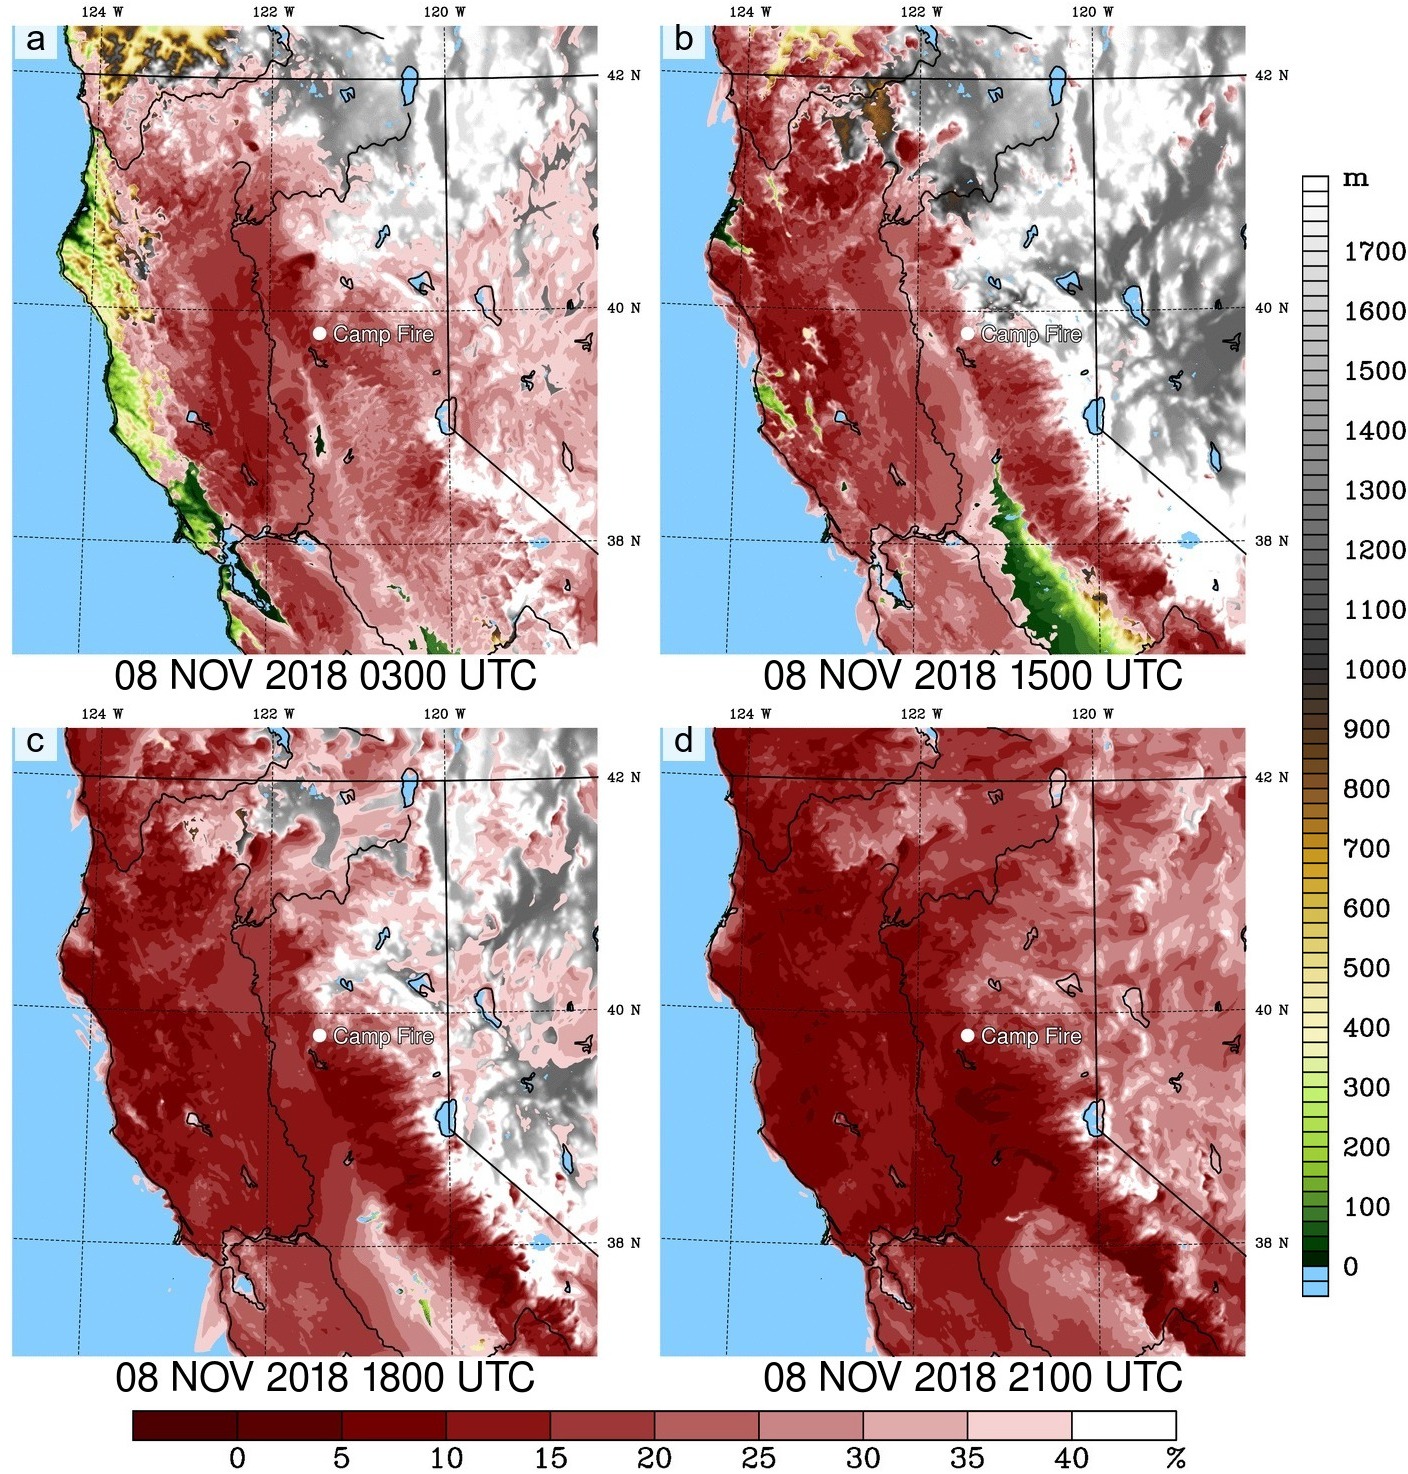
| Fig 17 4/3-km domain RH over terrain |
LATEST, RH <= 40% over black and white terrain
previous color scheme same as above but at lowest model level instead of 2m montage_paper_fig16.jpg loop loop version 4 tests |
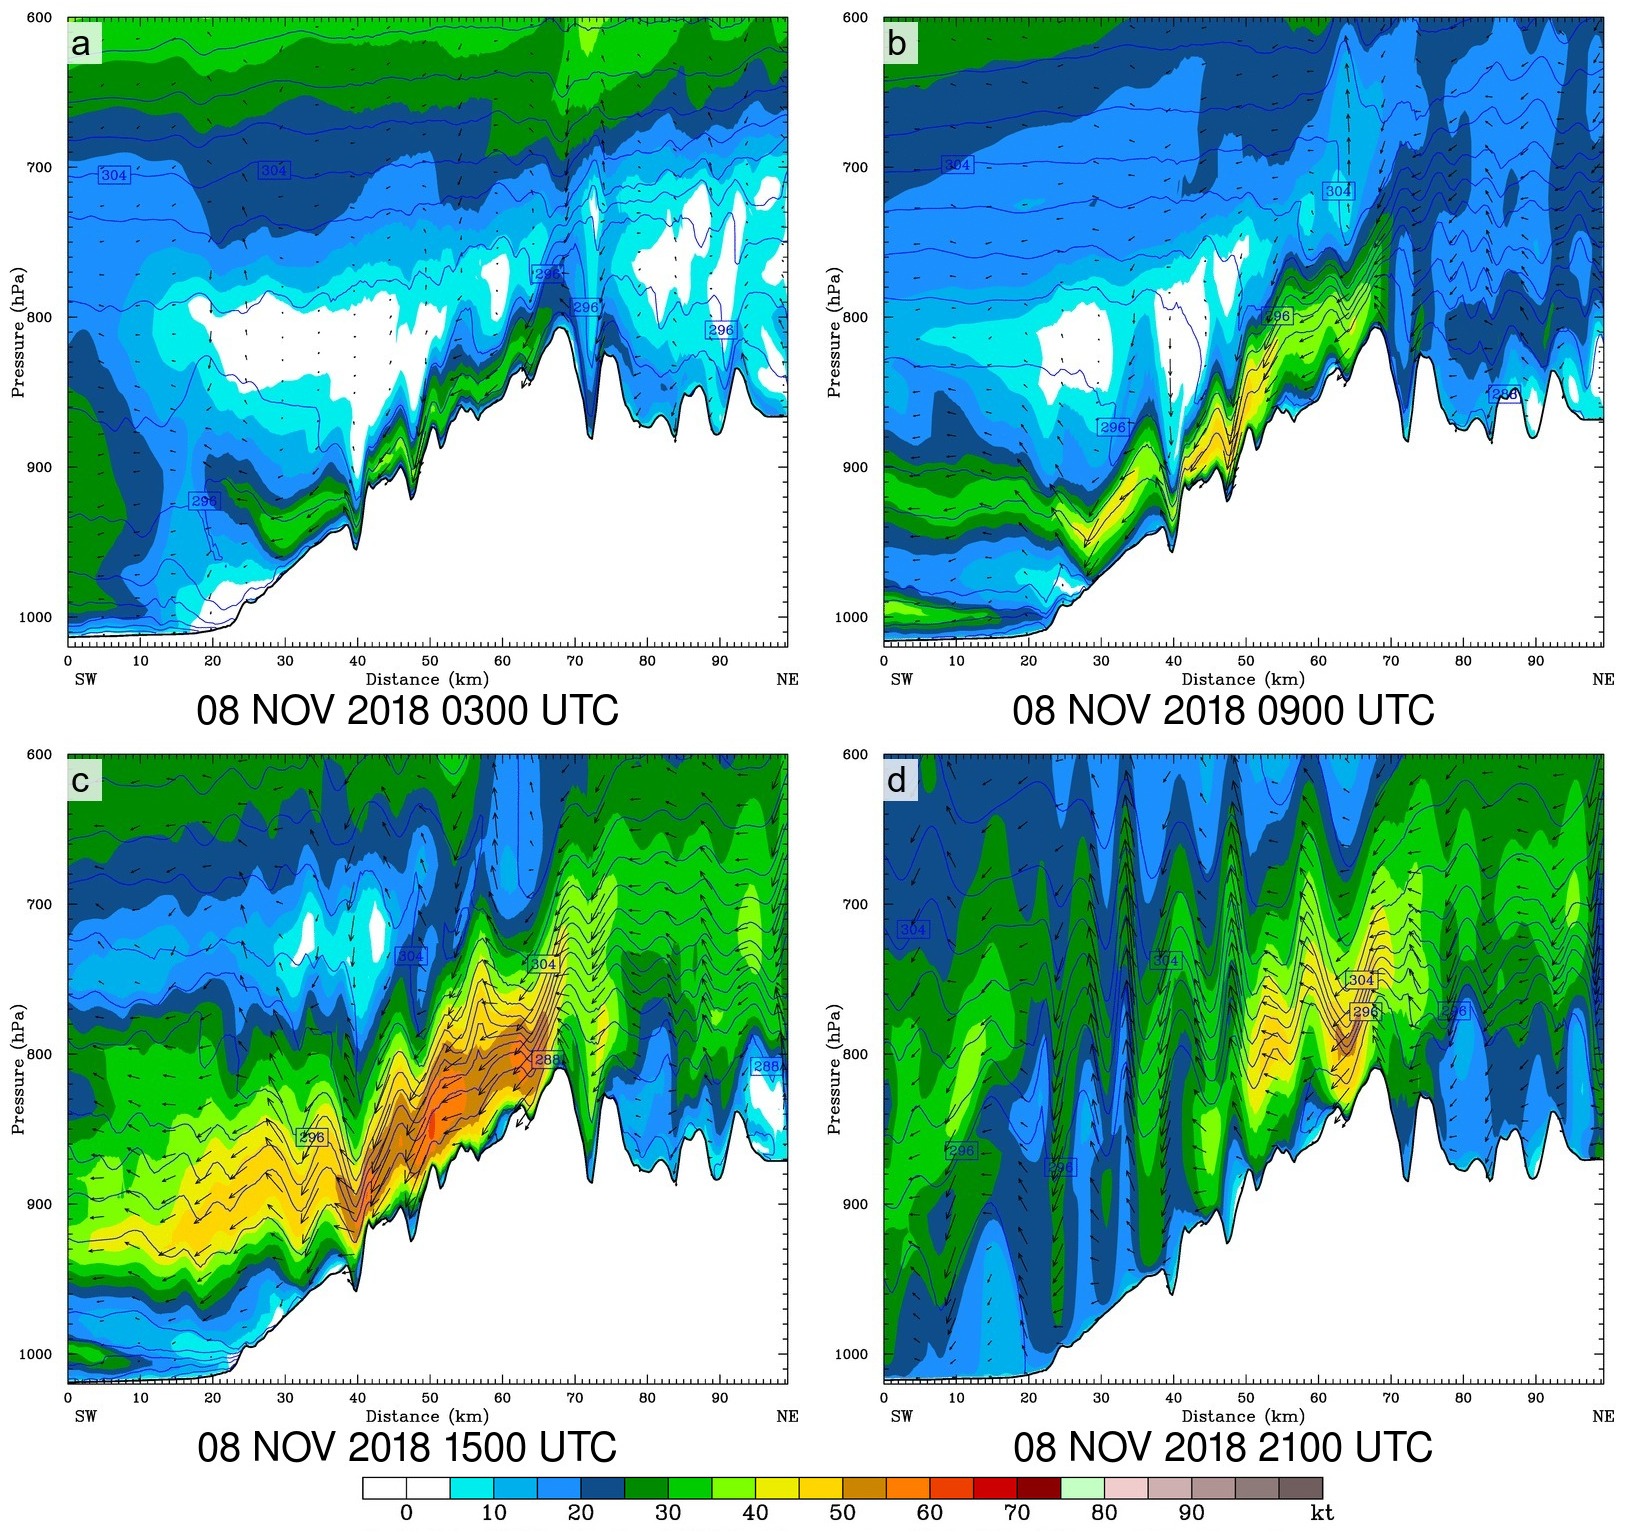
| Fig. 18 Four-panel vertical cross sections of wind speed through Paradise | LATEST |
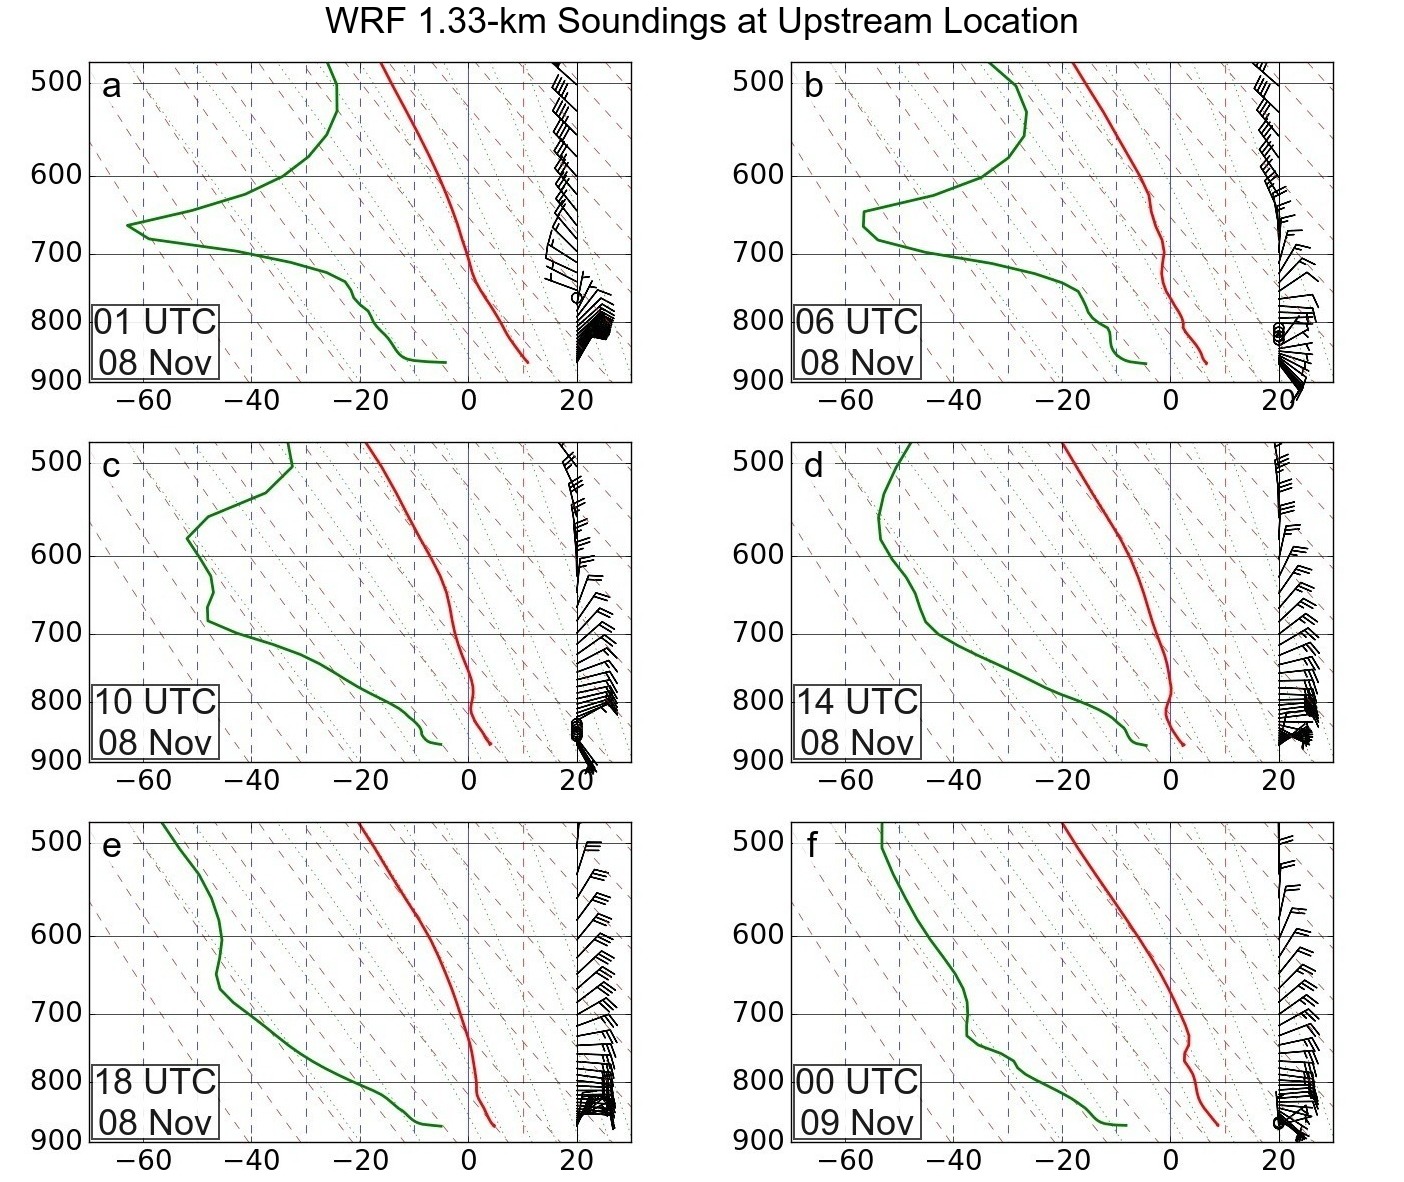
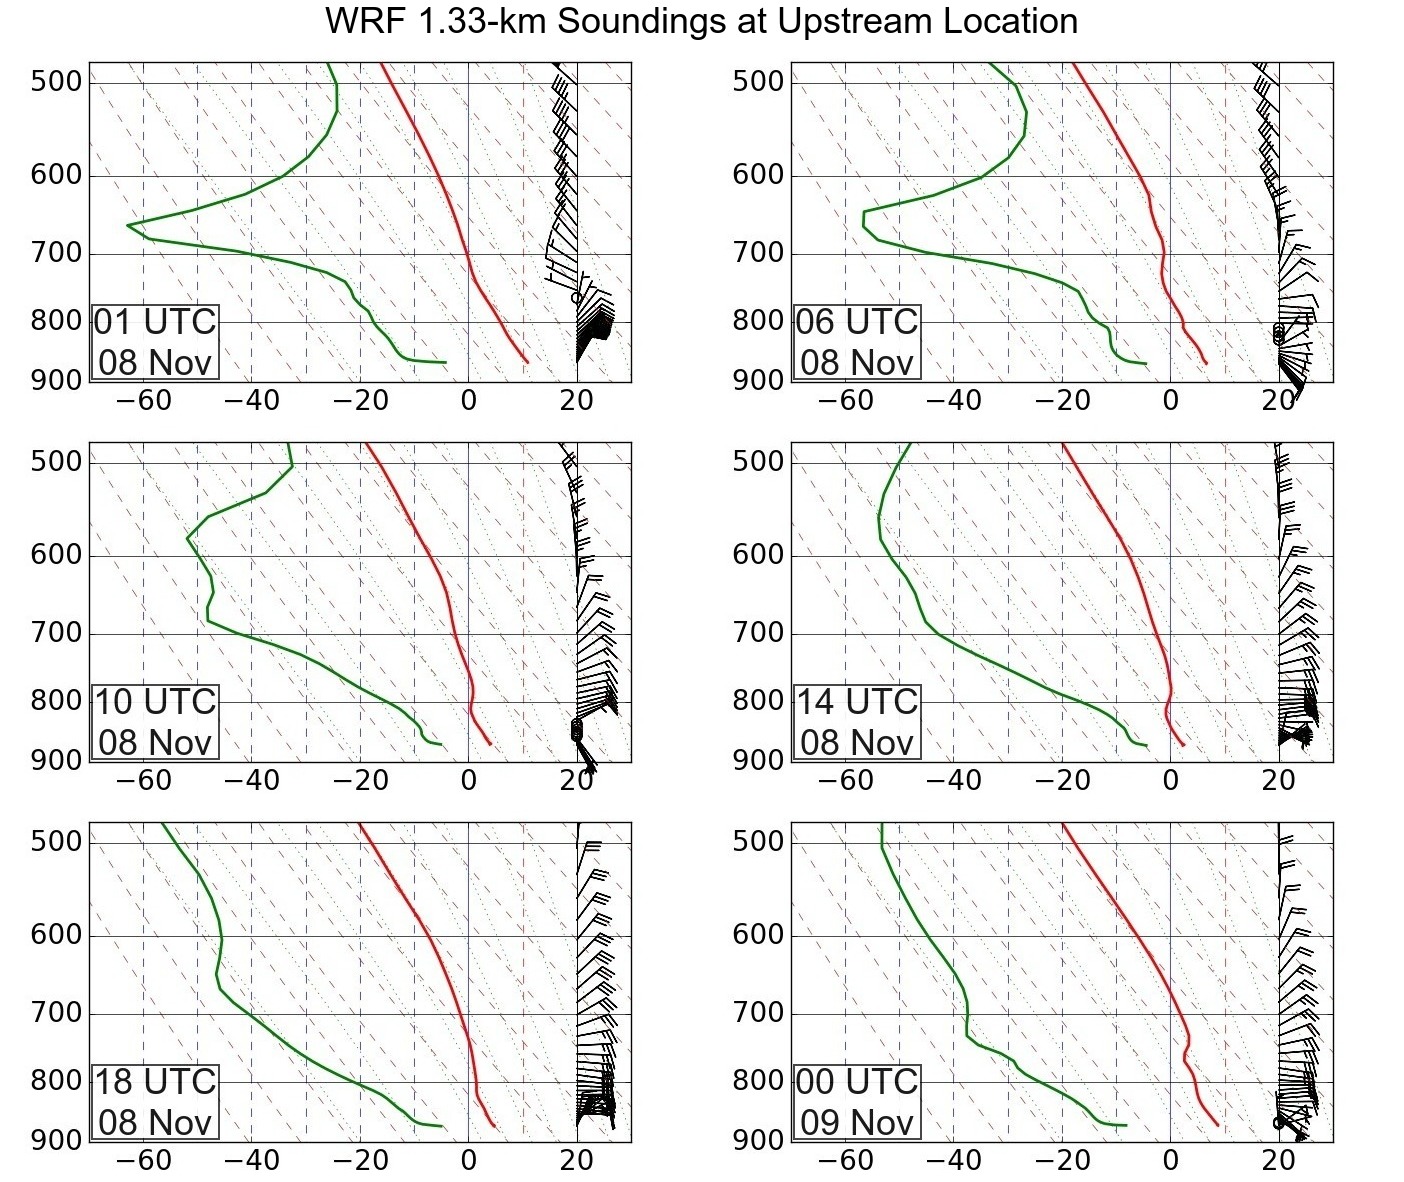
| Fig. 19 4/3-km domain soundings at Upstream location |
LATEST, version 4, times in bottom left plus letters upper left
version 1 version 2 version 3, times in bottom left loop |
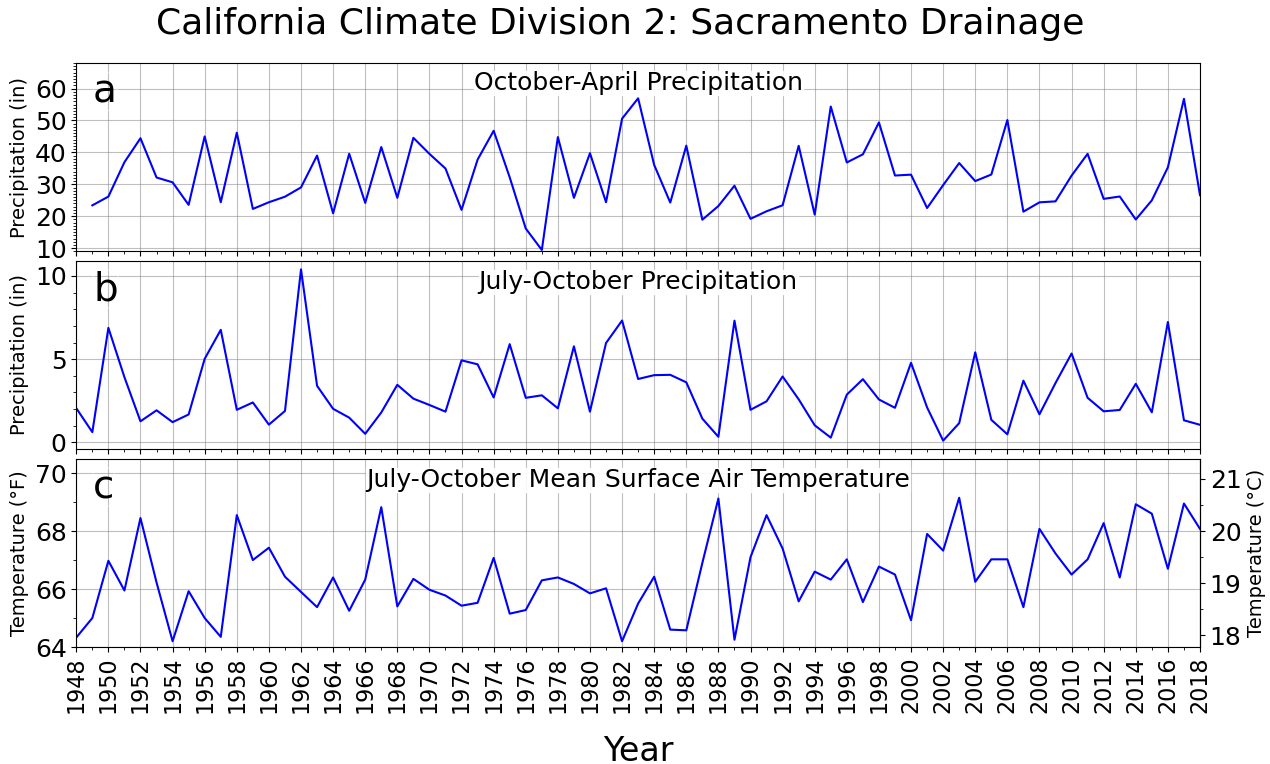
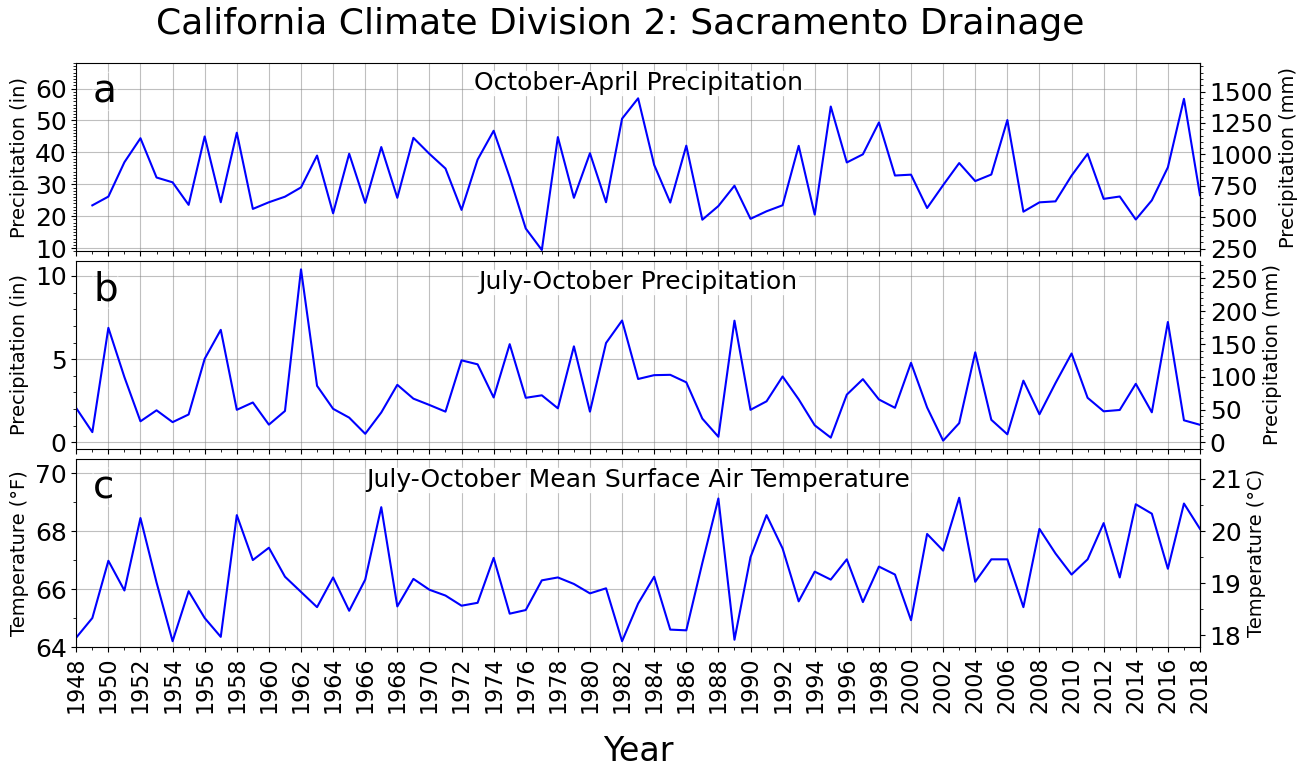
| Fig. 20 Sacramento Drainage Precip and Temperature |
LATEST
Second version with all units |
| Fig. 22 HRRR winds and surface wind gusts |
LATEST
similar but scale in m/s |
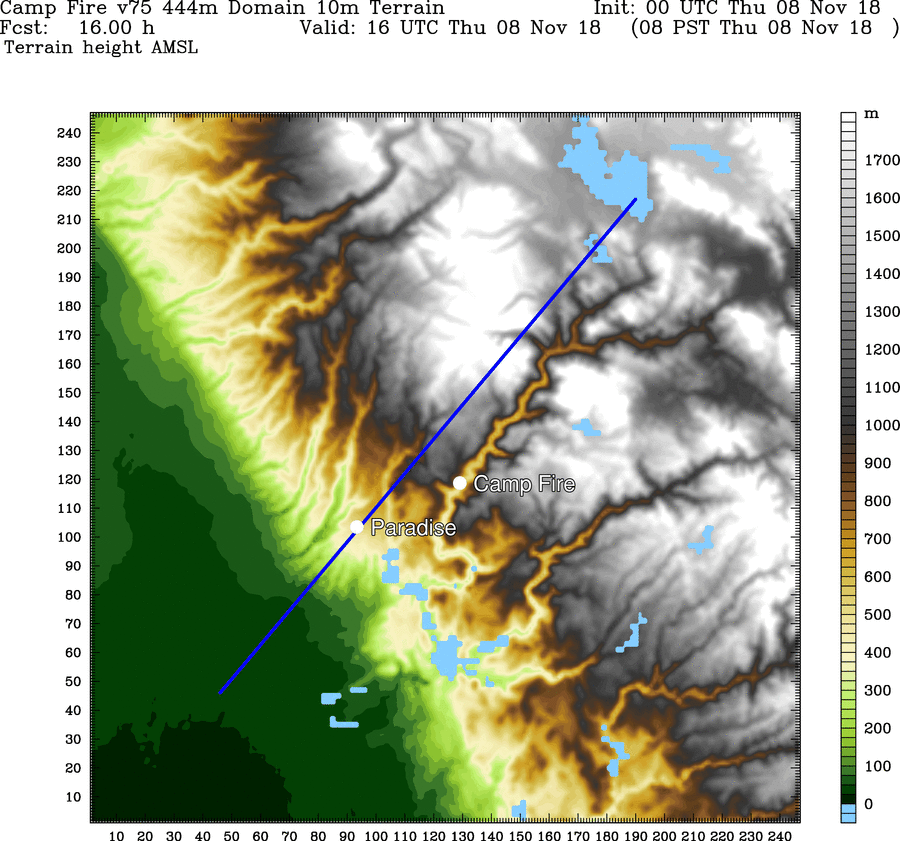
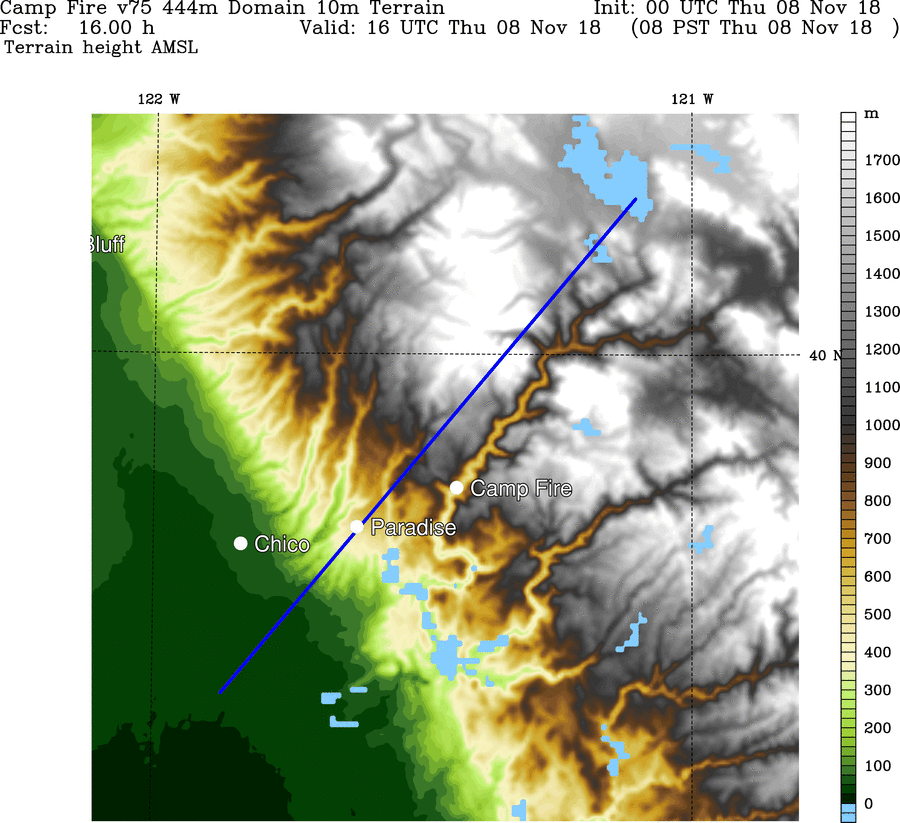
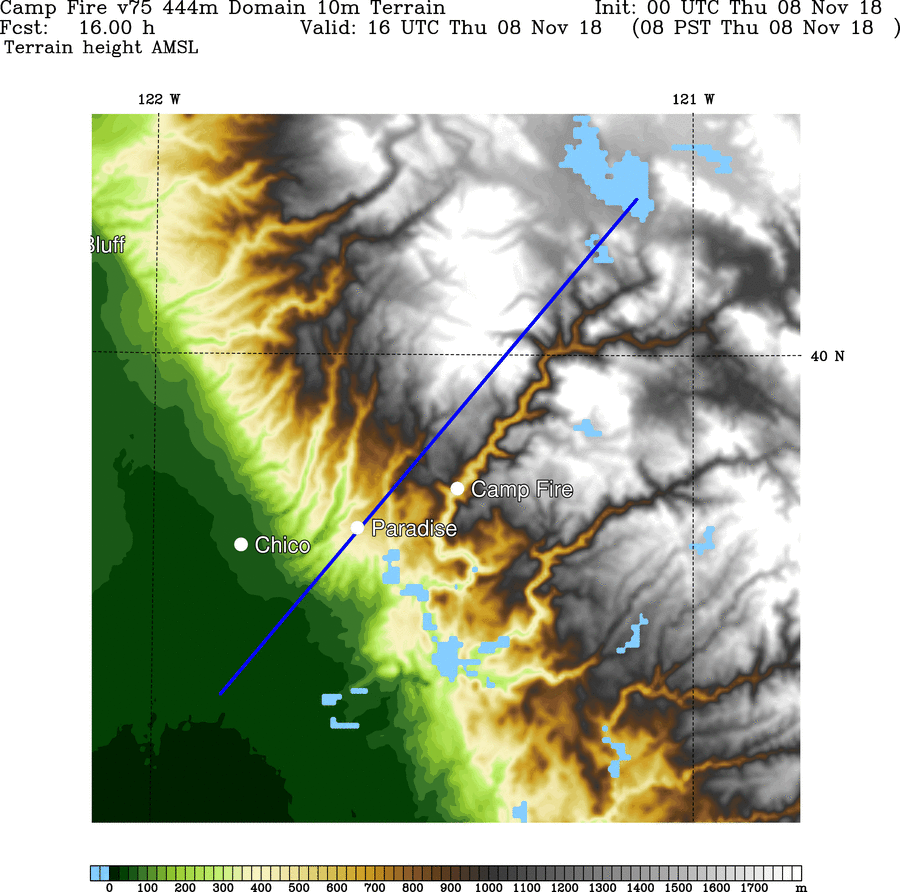
| High resolution terrain and cross section location |
fig19.gif
new version, adds Chico and lat/lon with color bar right 3rd version, adds Chico and lat/lon with color bar below |
| Domain | Product | Hour | Case |
|---|---|---|---|
.png)