| Case Name | Description | Full namelist |
|---|---|---|
| 3. enshrrr | HRRR physics: Thompson Aerosol Aware microphysics*, RRTMG LW and SW, radt=15*, MYNN sfc layer*, Noah LSM, MYNN 2.5-level TKE PBL*, no mosaic landuse in Noah*, no shallow cu*, no FDDA*, diff_opt=1*, diff_6th_factor=0.25*, diff_6th_opt=2*, tke_adv_opt=1* | namelist.input.enshrrr |
| 4. enswrf4mynn | Thompson microphysics, RRTMG LW and SW, Noah LSM, MYNN sfc layer*, no shallow cu*, tke_adv_opt=1* | namelist.input.enswrf4mynn |
| 5a. gfsn | same as wrfgfs except Noah LSM for all runs Dec 2021 through Jan 2022 | namelist.input.gfsn |
| 5b. gfsnmp | same as wrfgfs except Noah-MP LSM* for all runs Dec 2021 through Jan 2022 | namelist.input.gfsnmp |
| 5c. gfsruc | same as wrfgfs except RUC LSM* for all runs Dec 2021 through Jan 2022 | namelist.input.gfsruc |
| 5d. gfsruc3 | same as hn3 except RUC LSM* for all runs Dec 2021 through Jan 2022 snow physics: Thompson Aerosol Aware microphysics*, RRTMG LW, Goddard SW*, radt=30, Old MM5 surface layer*, RUC LSM*, MYNN 2.5-level TKE PBL*, mosaic landuse and soil, no shallow cu, FDDA and real-time dynamics settings: diff_opt=2, diff_6th_otp=0, tke_adv_opt=0 | namelist.input.gfsruc3 |
| 6. hn2 | same as enshrrr except: Goddard shortwave radiation*, mosaic landuse in Noah, and real-time dynamics settings: diff_opt=2, diff_6th_otp=0, tke_adv_opt=0 | namelist.input.hn2 |
| 6b. hn3 | snow physics: Thompson Aerosol Aware
microphysics*, RRTMG LW, Goddard SW*, radt=30, Old MM5
surface layer*, Noah LSM, MYNN 2.5-level TKE PBL*,
mosaic landuse in Noah, no shallow cu, FDDA and real-time dynamics settings: diff_opt=2, diff_6th_otp=0, tke_adv_opt=0 | namelist.input.hn3 |
| 6c. hn3c273 | exact same as hn3 except remove snow from wrfinput where top soil temp >= 273.15K exact same as hnmp3s3c273 except Noah vs Noah-MP LSM snow physics: Thompson Aerosol Aware microphysics*, RRTMG LW, Goddard SW*, radt=30, Old MM5 surface layer*, Noah LSM, MYNN 2.5-level TKE PBL*, mosaic landuse in Noah, no shallow cu, FDDA and real-time dynamics settings: diff_opt=2, diff_6th_otp=0, tke_adv_opt=0 | namelist.input.hn3c273 |
| 7. hnmp2 | exactly like hn2 except Noah-MP LSM* | namelist.input.hnmp2 |
| 8. hnmp3 | exact physics as hnmp2 except Noah-MP code mods wrf.exe.nmpmods1: increase minimum snow-depths from from 0 and 5 cm to 15 cm | namelist.input.hnmp3 module_sf_noahmplsm.F.nmpmods1 compare to module_sf_noahmplsm.F.orig |
| 9. hnmp3s1 | like hnmp3 used code wrf.exe.npmmods1, except Thompson microphysic,RRTM LW*, Dudhia SW*, radt=15*, Old MM5 surface layer, YSU PBL, FDDA | namelist.input.hnmp3s1 |
| 10. hnmp3s2 | like hnmp3 used code wrf.exe.npmmods1 except
radt=30, Old MM5 surface layer*, FDDA best snow physics: Thompson Aerosol Aware microphysics*, RRTMG LW, Goddard SW*, radt=30, Old MM5 surface layer*, Noah-MP LSM, MYNN 2.5-level TKE PBL*, mosaic landuse in Noah, no shallow cu, FDDA and real-time dynamics settings: diff_opt=2, diff_6th_otp=0, tke_adv_opt=0 identical physics to hn3 except Noah-MP instead of Noah LSM |
namelist.input.hnmp3s2 |
| 11. hnmp3s3 | exact same physics as hnmp3s2 except used code
wrf.exe.npmmods2 which uses Verseghy 1991 thermal conductivity of
snow calculation though constrained to be <= 0.25 best snow physics: Thompson Aerosol Aware microphysics*, RRTMG LW, Goddard SW*, radt=30, Old MM5 surface layer*, Noah-MP LSM, MYNN 2.5-level TKE PBL*, mosaic landuse in Noah, no shallow cu, FDDA and real-time dynamics settings: diff_opt=2, diff_6th_otp=0, tke_adv_opt=0 |
namelist.input.hnmp3s3 |
| 11a. hnmp3s3c273 | exact same physics as hnmp3s3 except removed snow from
wrfinput files where top soil temp >= 273.15K best snow physics: Thompson Aerosol Aware microphysics*, RRTMG LW, Goddard SW*, radt=30, Old MM5 surface layer*, Noah-MP LSM, MYNN 2.5-level TKE PBL*, mosaic landuse in Noah, no shallow cu, FDDA and real-time dynamics settings: diff_opt=2, diff_6th_otp=0, tke_adv_opt=0 |
namelist.input.hnmp3s3 |
| 11b. hnmp3s3myn | exact same physics and code as hnmp3s3 except used MYNN surface layer instead of old MM5 | namelist.input.hnmp3s3myn |
| 12. hnmp3s4 | exact same physics as hnmp3s2 except used code wrf.exe.npmmods3 which 1) increases minimum snow-depths from from 0 and 5 cm to 25 cm 2) uses Verseghy 1991 thermal conductivity of snow calculation though constrained to be <= 0.15 | namelist.input.hnmp3s4 |
| 13. hnmp | exact same physics as hnmp2 and hnmp3 except with RRTMG SW instead of Goddard | namelist.input.hnmp |
| 2. mm5eta | NAM initialization, MM5 3.6.1 code with simple Dudhia thermal diffusion surface layer, Kain-Fritsch cumulus, Dudhia simple ice microphysics, MRF PBL, Dudhia radiation, multil-layer soil model, no shallow convection | mmlif |
| 14. simple | Thompson microphysics, RRTM LW*, Dudhia SW*, radt=30, Old MM5 surface layer, thermal diffusion land-surface, YSU PBL, shallow cu | namelist.input.simple |
| 1. wrfgfs | real-time configuration, Noah-MP through Dec 18, 2021, Noah LSM from 2021121900 onward physics: Thompson microphysics, RRTMG LW and SW, radt=30, revised MM5 Monin-Obukhov sfc layer, Noah or Noah-MP LSM, YSU PBL, shallow cu, | namelist.input.wrfgfs |
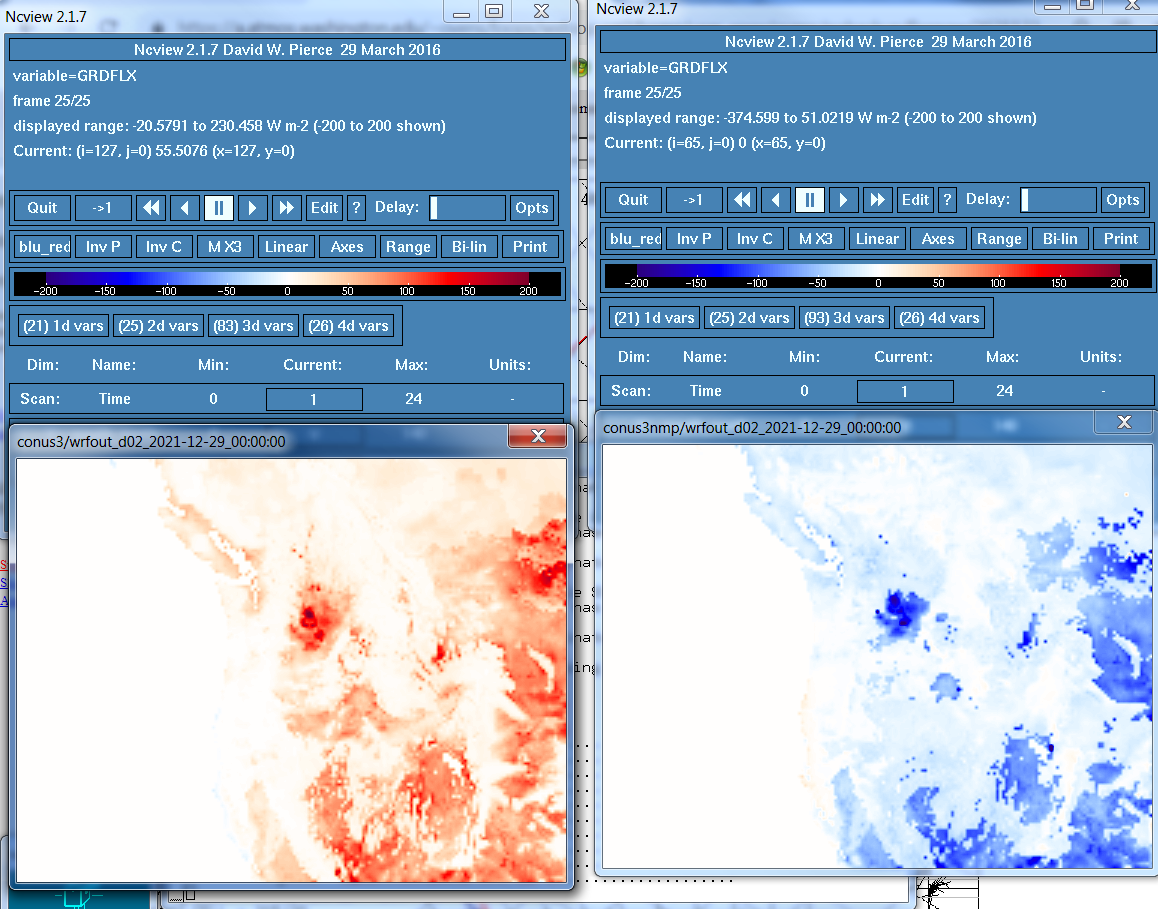
conus3nmp = same as conus3 but with Noah-MP instead
conus3 = Noah + Thompson + RRTMG + MYNN* + Tiedtke
mynn_tkeavect, mynn_cloudpdf=2, mynn_mixlength=2,
mynn_edmf=2, mynn_edmf_tke=1, mynn_mixscalars=1
conus2 = Noah + Thompson + RRTMG + MYNN + Tiedtke
conus = Noah + Thompson + RRTMG + MYJ + Tiedtke
this is the CONUS physics suite
gfssfc = Noah-MP opt_stc=2 + Thompson + RRTMG + GFS sfclay + GFS PBL
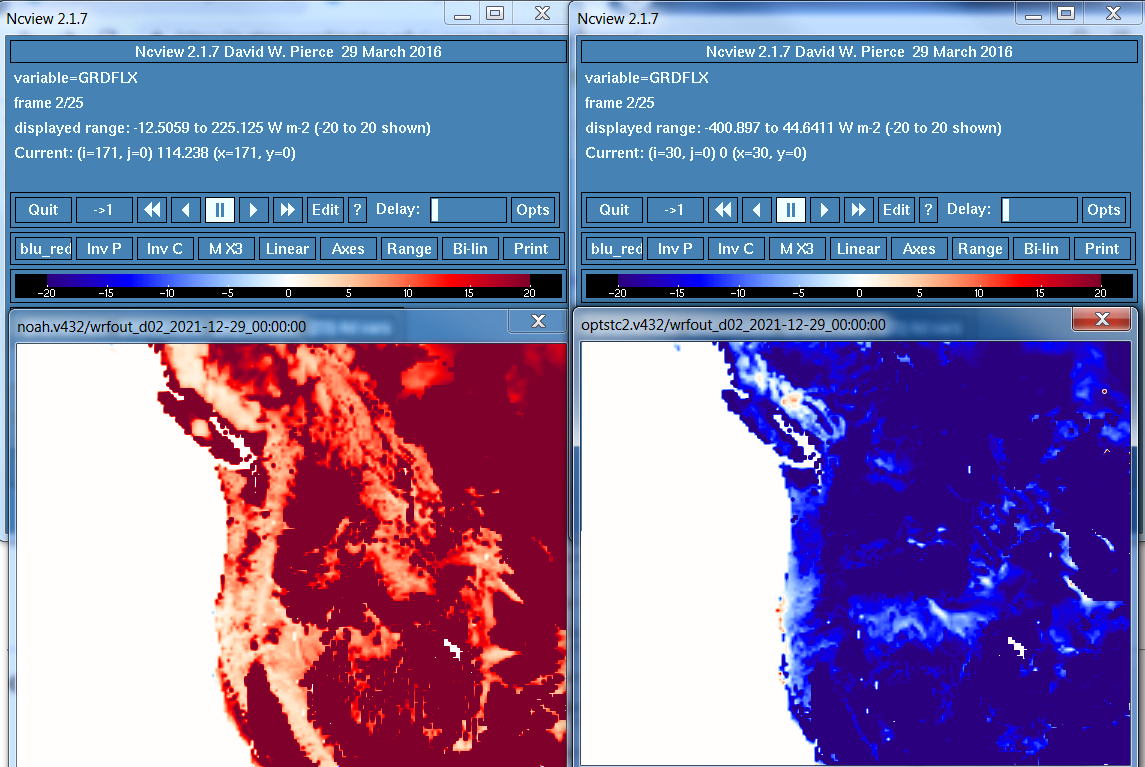
noah = Noah + Thompson + RRTMG
optstc2 = Noah-MP opt_stc=2 + Thompson + RRTMG
optstc2wsm = Noah-MP opt_stc=2 + WSM-6 + RRTMG
optstc2wsmgoddard = Noah-MP opt_stc=2 + WSM-6 + Goddard radiation
| UTC | Observed | noah | optstc2 | optstc2wsm | optstc2wsmgoddard |
|---|---|---|---|---|---|
| 02 | 26F -3.3C 269.8K | 26F -3.1C 270K | 17F -8.6C 264.6K | 20F -6.6C 266.6K | 22F -5.4C 267.8K |
| 12 | 24F -4.4C 268.7K | 26F -3.3C 269.8K | 18F -7.7C 265.5K | 13F -10.5C 262.7K | 20F -6.5C 266.7K |
| Initialization | Domain | Product | Hour | Case |
|---|---|---|---|---|
| Period | Field | Statistic | Hour | Station Group | Cases (control click to select multiple) |
|---|---|---|---|---|---|
d2.t2m.mae.dec21jan22.00.24.whole_d2_all_sites.gif+-simple)
d2.t2m.me.dec21jan22.00.24.whole_d2_all_sites.gif+-simple)
d2.t2m.mae.dec21jan22.00.24.whole_d2_sa_only.gif+-simple)
d2.t2m.me.dec21jan22.00.24.whole_d2_sa_only.gif+-simple)
d2.t2m.mae.dec21jan22.00.12.whole_d2_all_sites.gif+-simple)
d2.t2m.me.dec21jan22.00.12.whole_d2_all_sites.gif+-simple)
d2.t2m.mae.dec21jan22.00.12.whole_d2_sa_only.gif+-simple)
d2.t2m.me.dec21jan22.00.12.whole_d2_sa_only.gif+-simple)