The log![]() transformation is simply
transformation is simply
![]() and is selected by appending an l
(lower case L) immediately following the scale (or axis length)
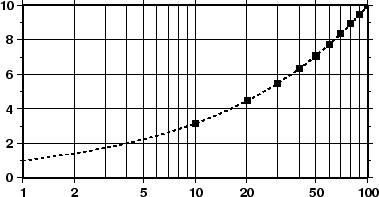
value. Hence, to produce a plot in which the x-axis is
logarithmic (the y-axis remains linear, i.e., a semilog plot), try
and is selected by appending an l
(lower case L) immediately following the scale (or axis length)
value. Hence, to produce a plot in which the x-axis is
logarithmic (the y-axis remains linear, i.e., a semilog plot), try
psxy -R1/100/0/10 -Jx1.5il/0.15i -B2g3/a2f1g2WSne -W1t2_2:0p -P -K -H sqrt.d > GMT_log.ps
psxy -R -Jx -Ss0.075i -Gblack -W -O -H sqrt.d10 >> GMT_log.ps
Note that if x- and y-scaling are different and
a log![]() -log
-log![]() plot is desired, the l must be
appended twice: Once after the x-scale (before the /) and
once after the y-scale.
plot is desired, the l must be
appended twice: Once after the x-scale (before the /) and
once after the y-scale.