| Site | All Times | Aug and Sep Only | Aug and Sep Only FSL data |
|---|---|---|---|
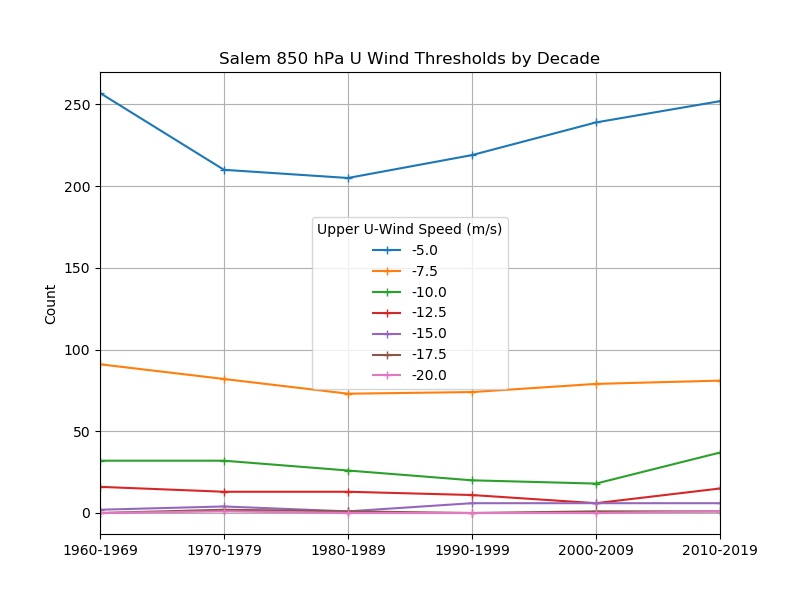
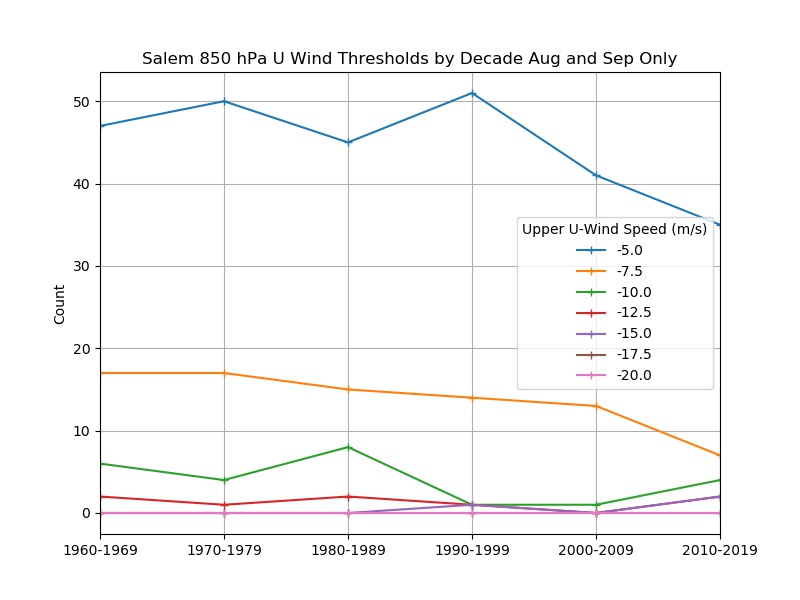
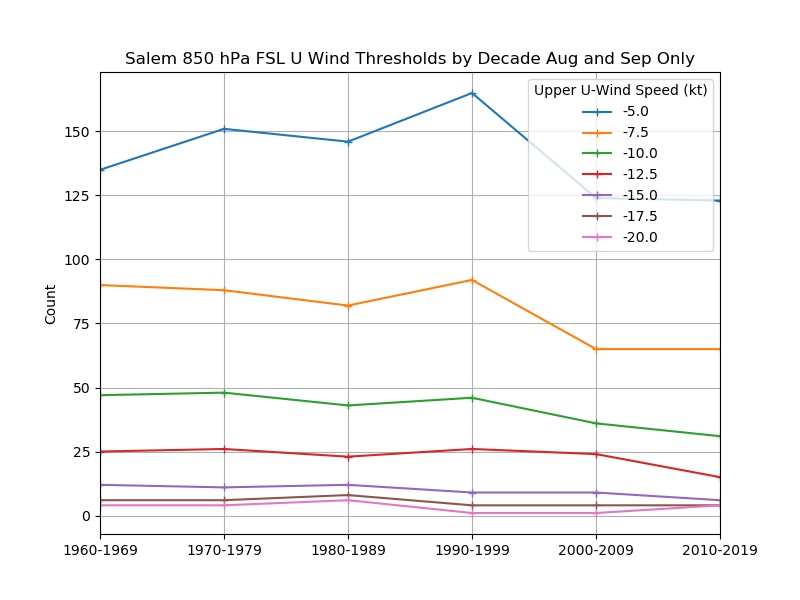
| Salem | 850 | 850 | 850 |
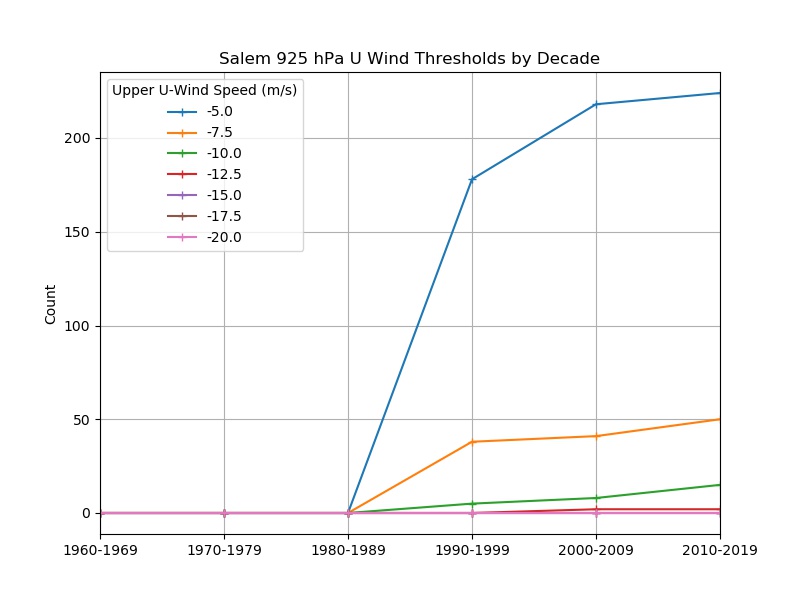
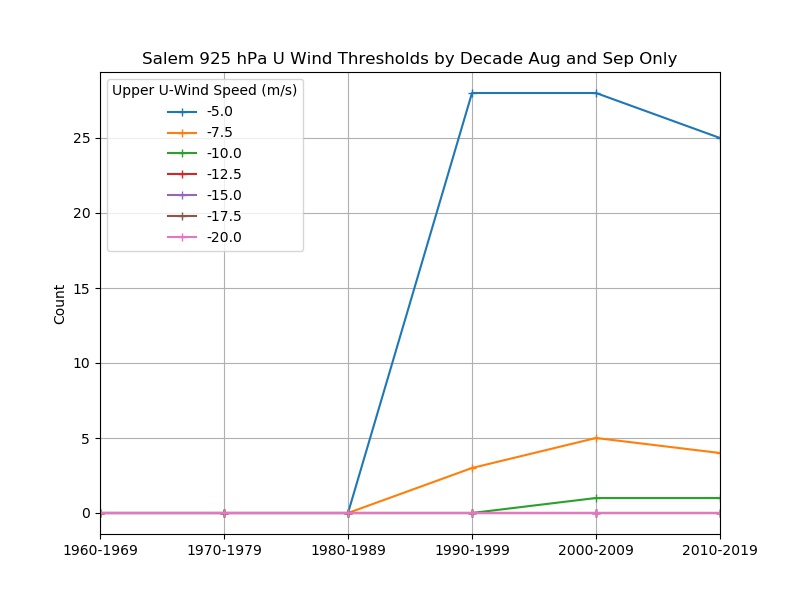
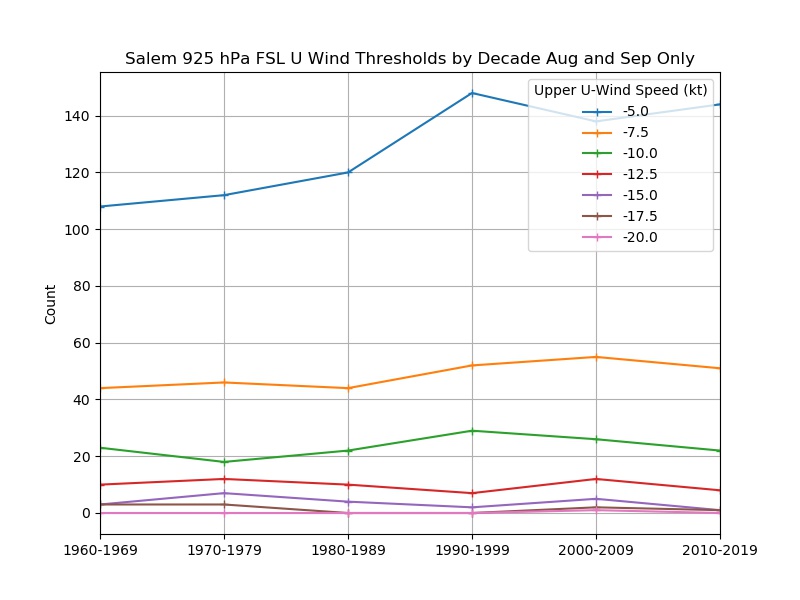
| 925 | 925 | 925 | |
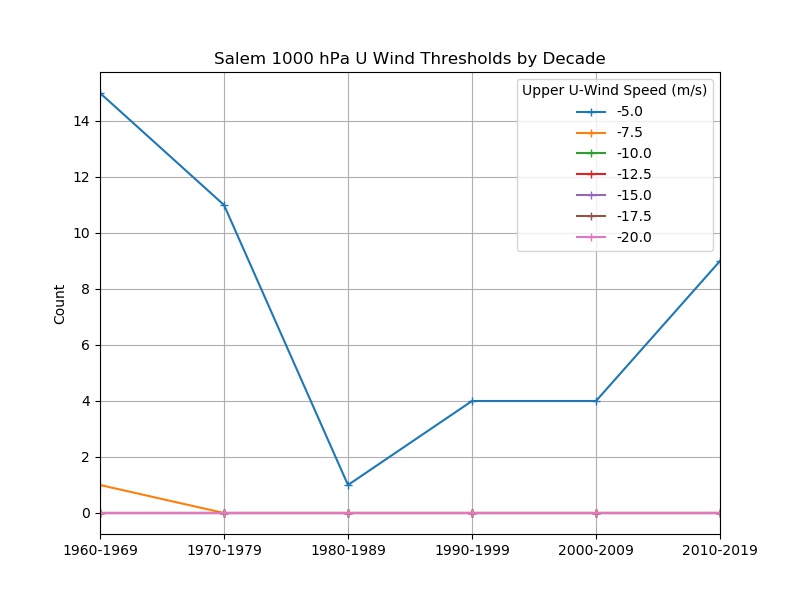
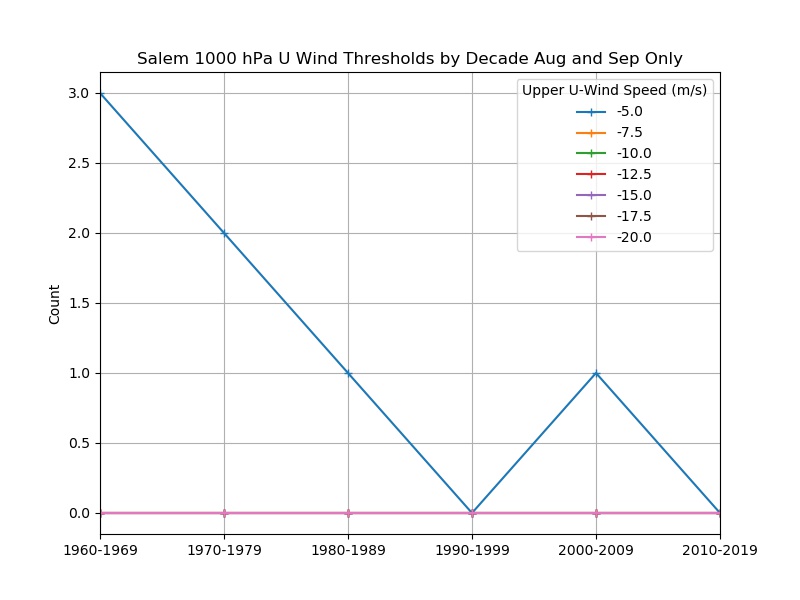
| 1000 | 1000 | 1000 | |
| Surface | Surface | Surface | |
| loop all | loop all | loop all | |
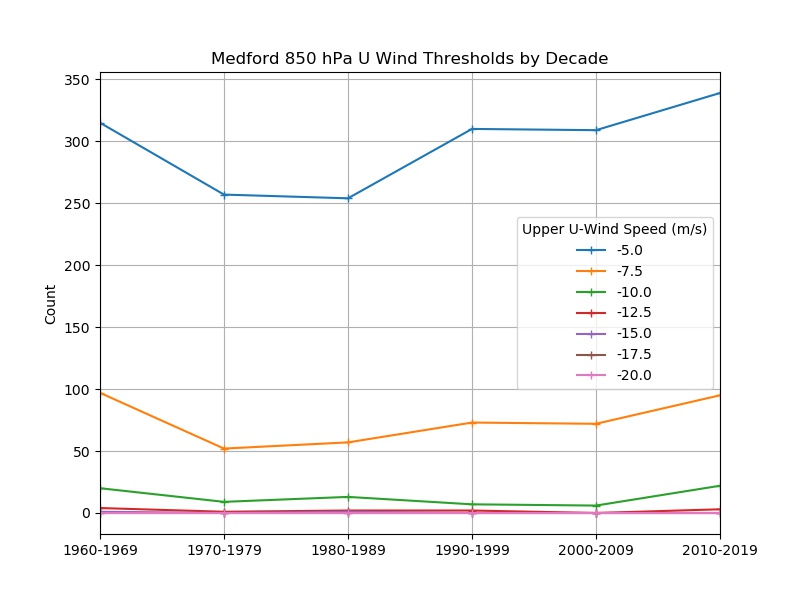
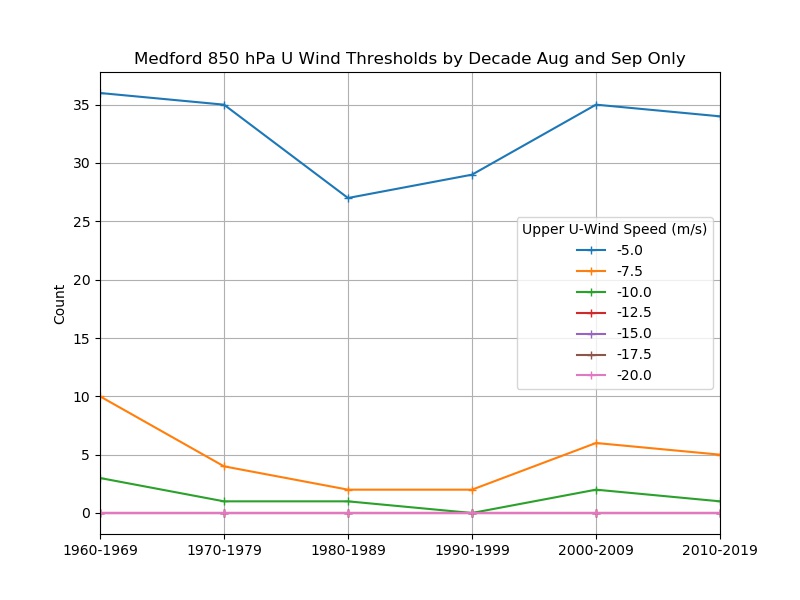
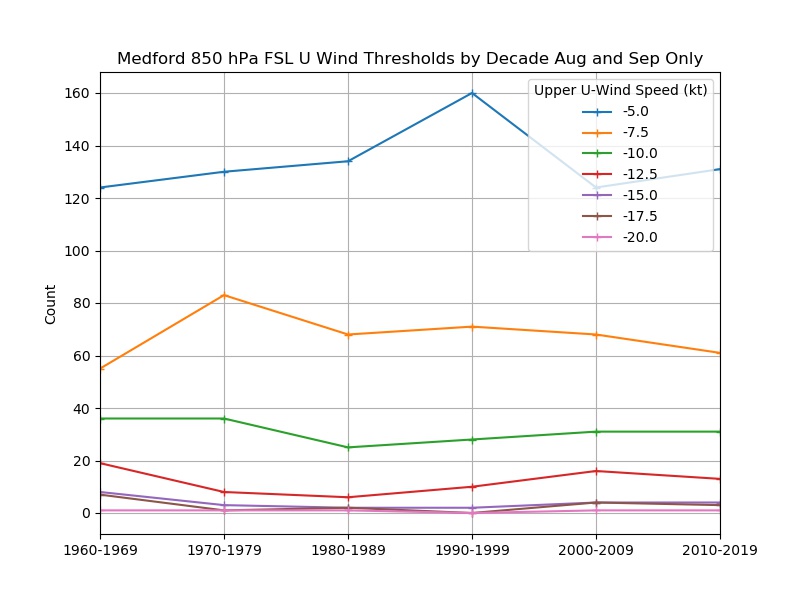
| Medford | 850 | 850 | 850 |
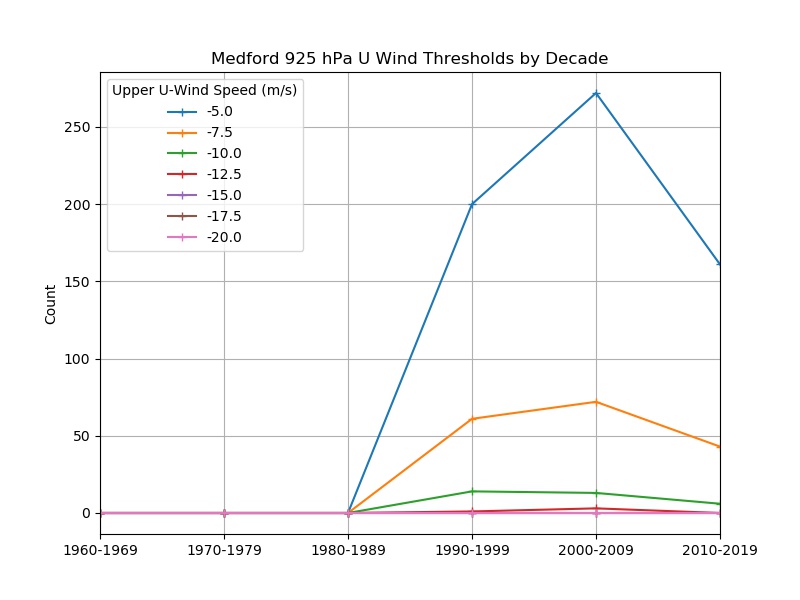
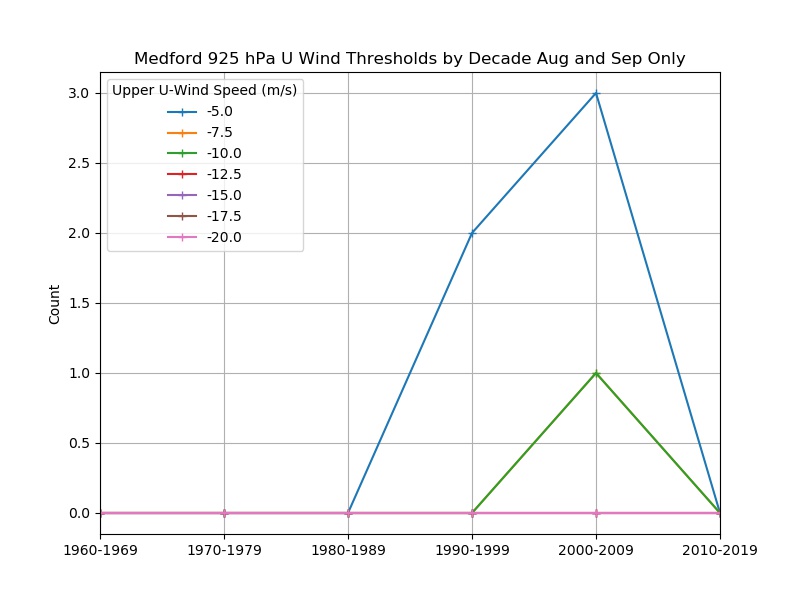
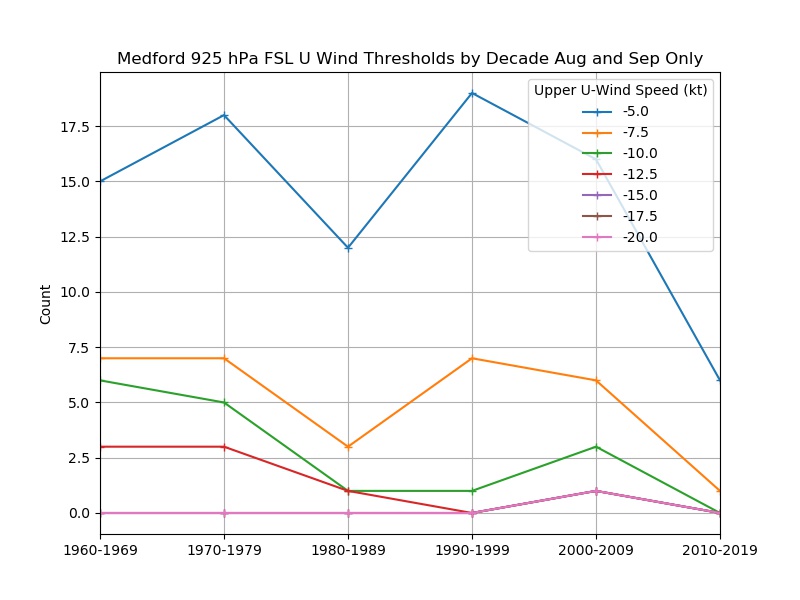
| 925 | 925 | 925 | |
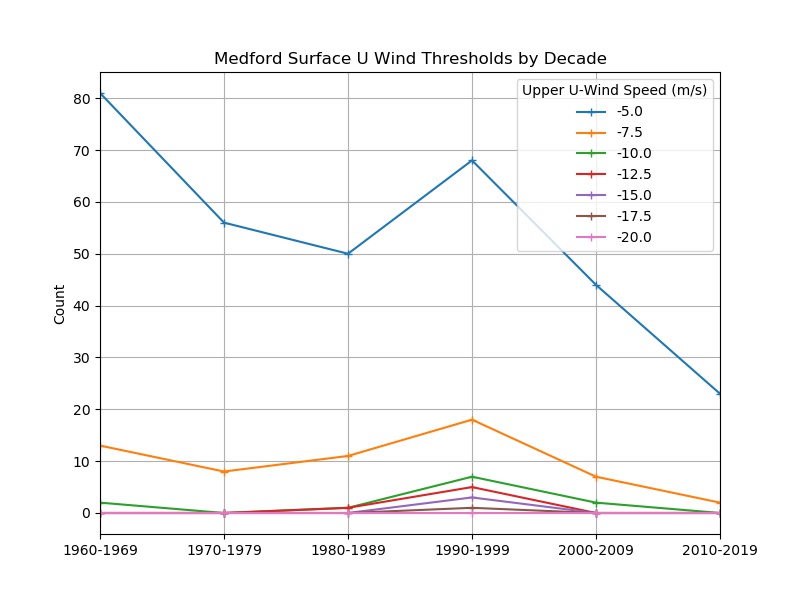
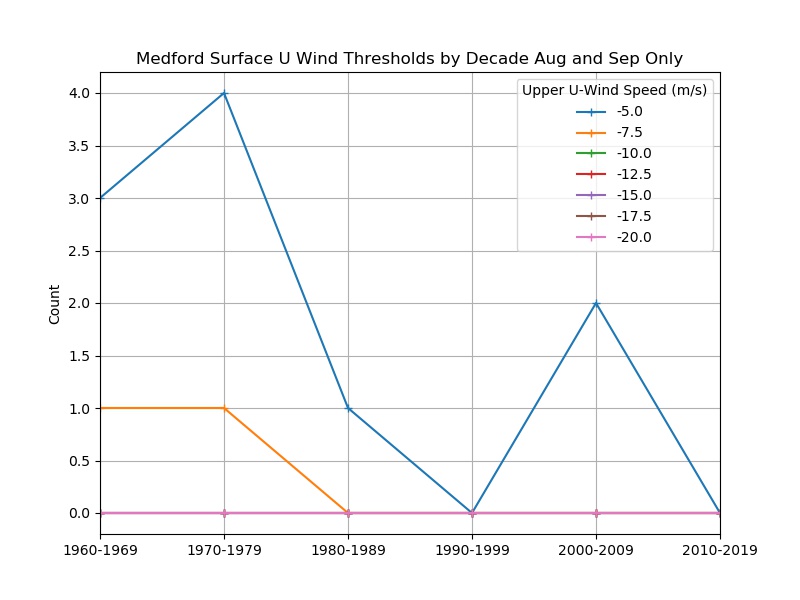
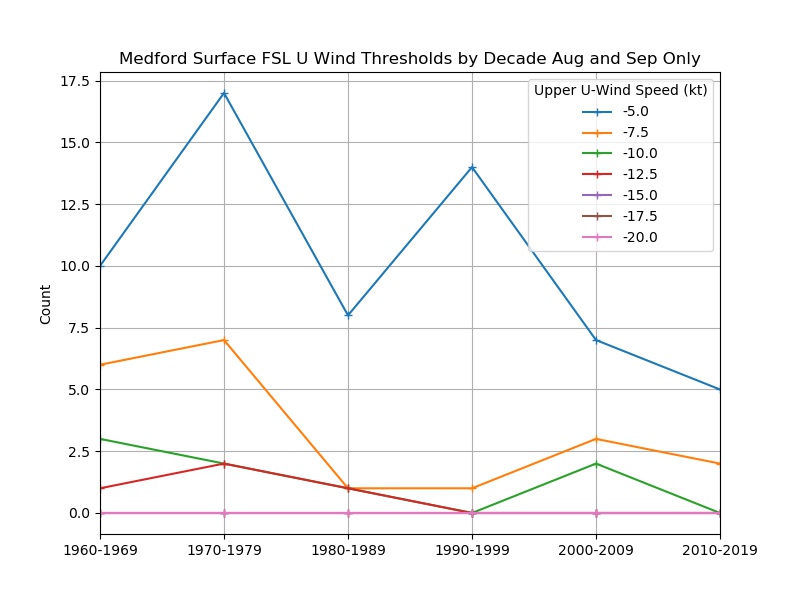
| Surface | Surface | Surface | |
| loop all | loop all | loop all | |
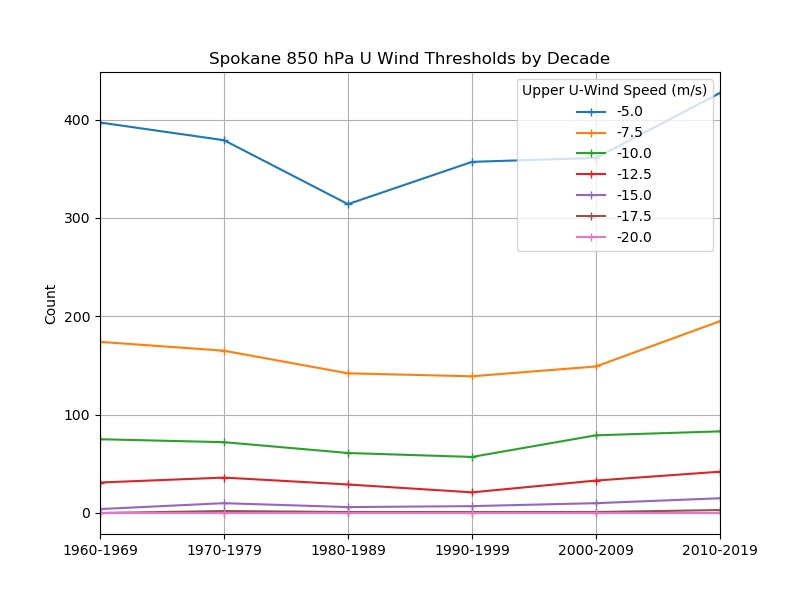
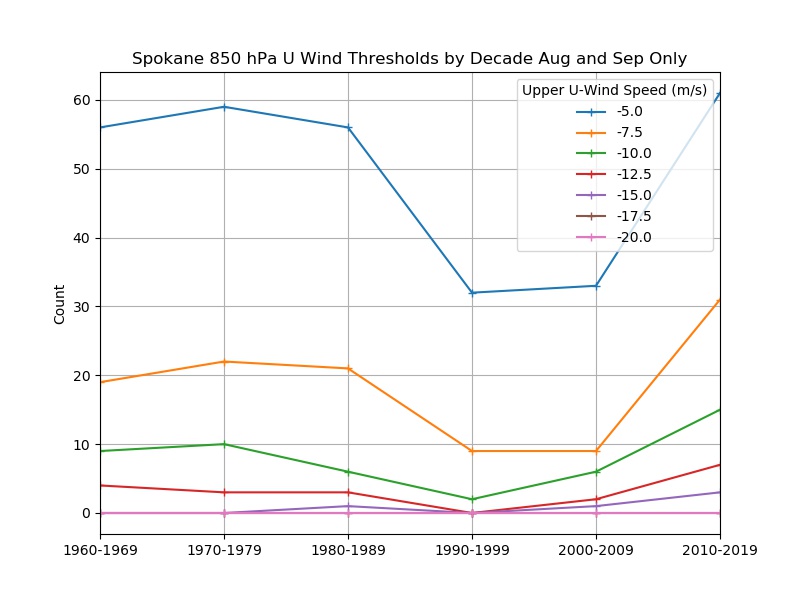
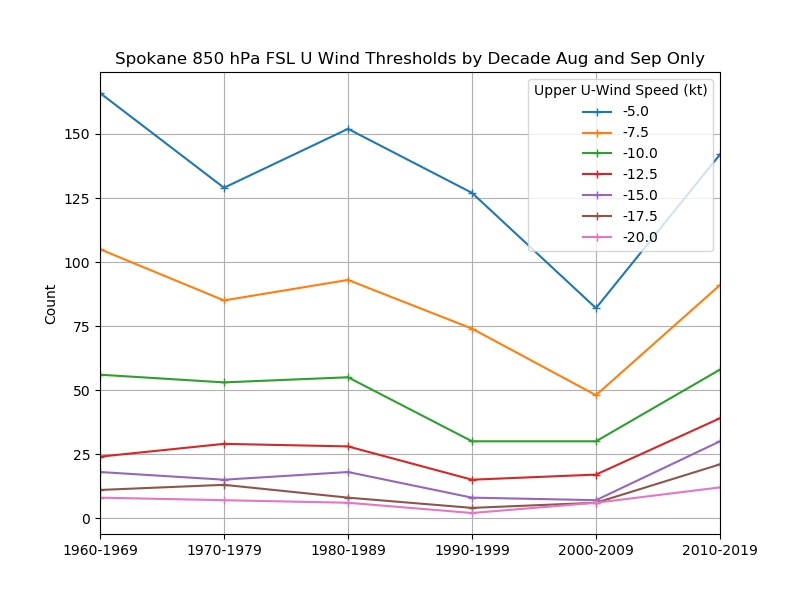
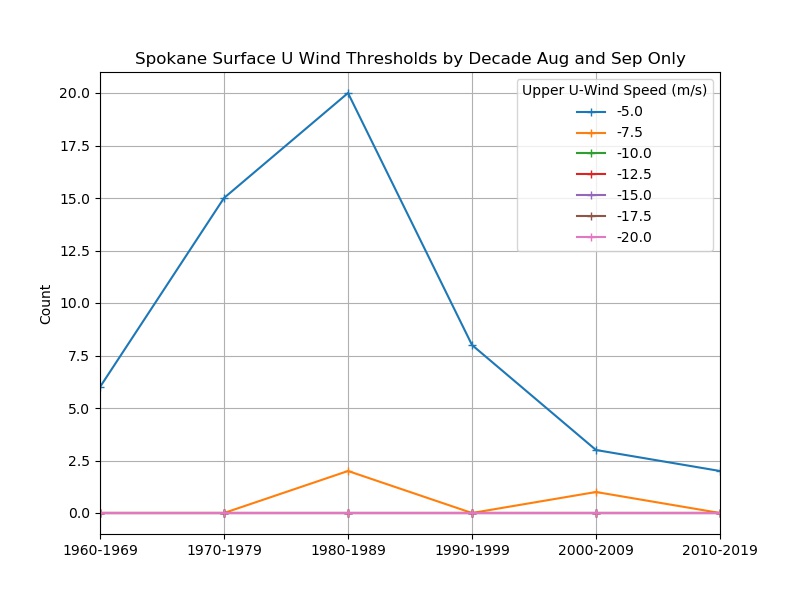
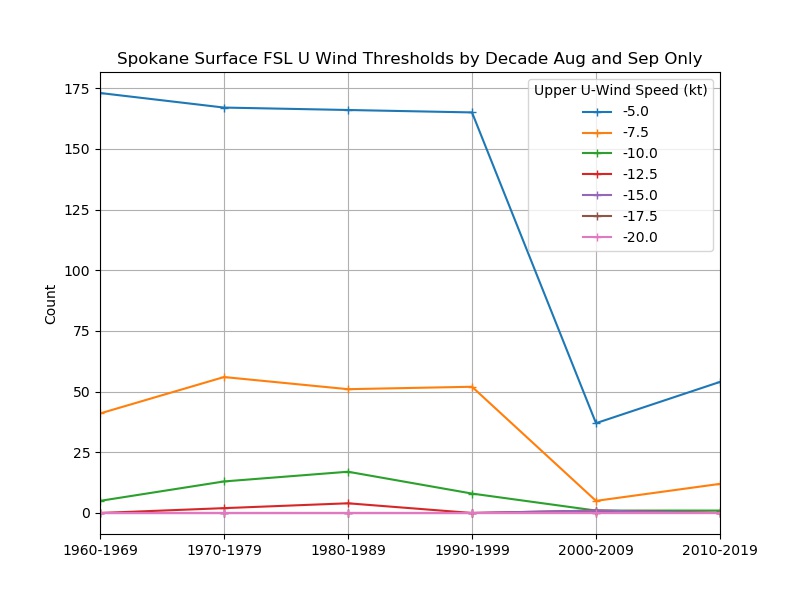
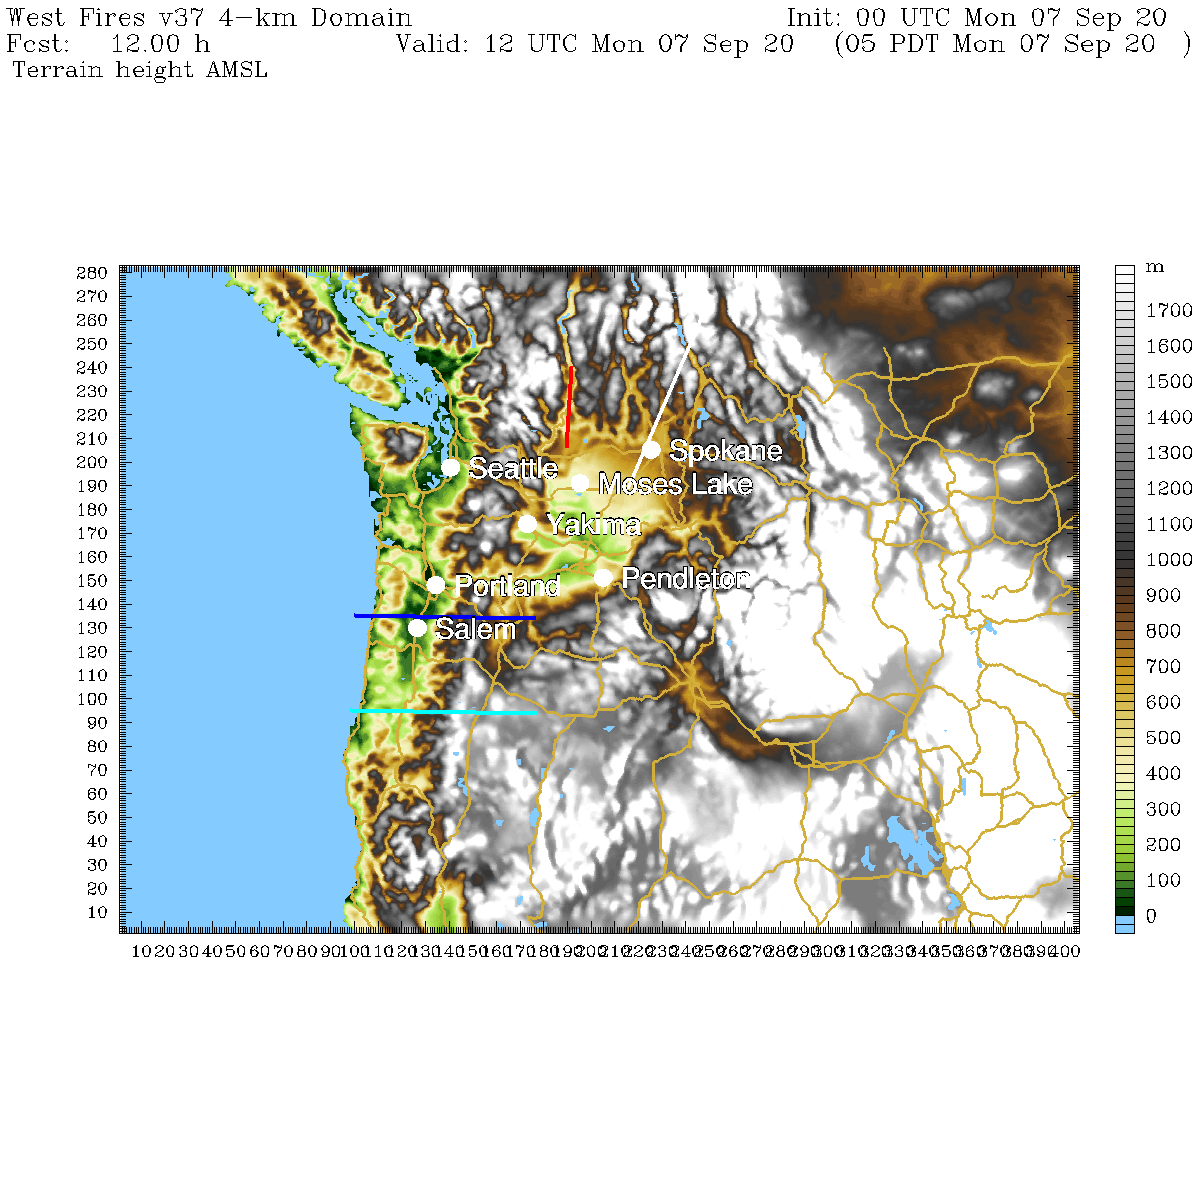
| Spokane | 850 | 850 | 850 |
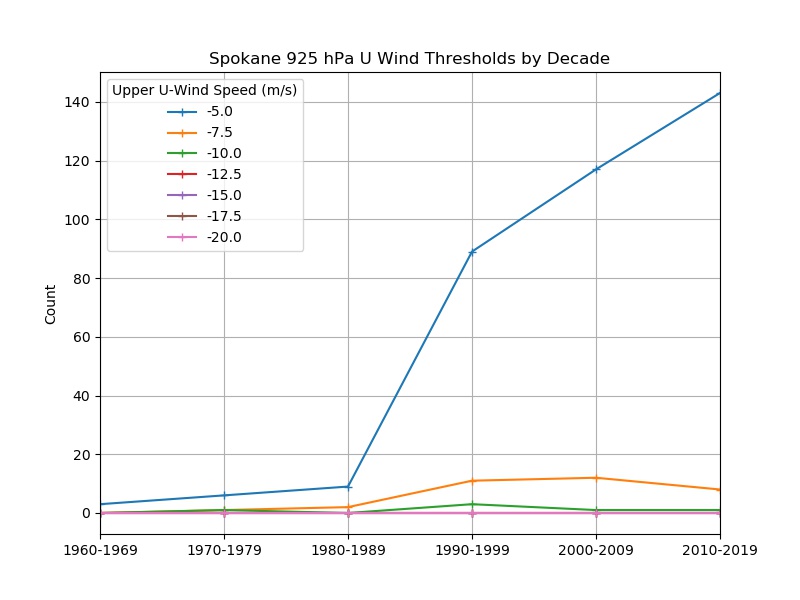
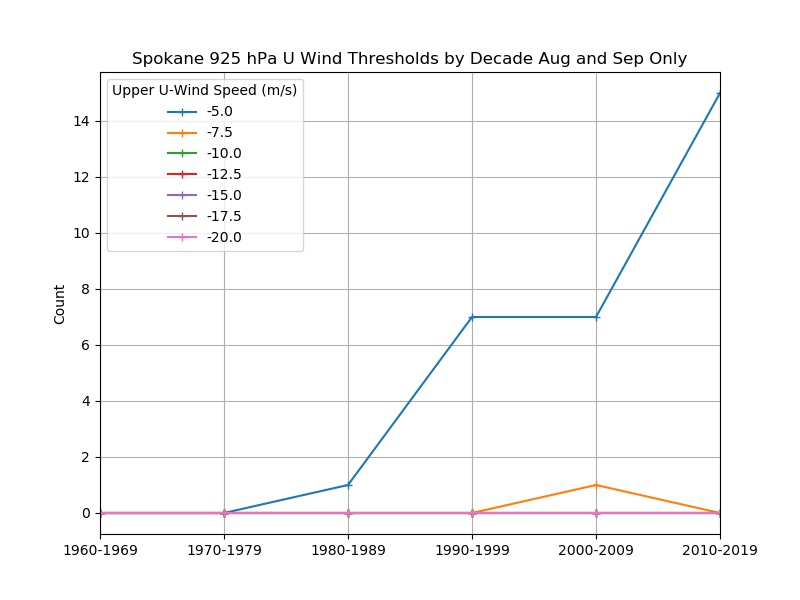
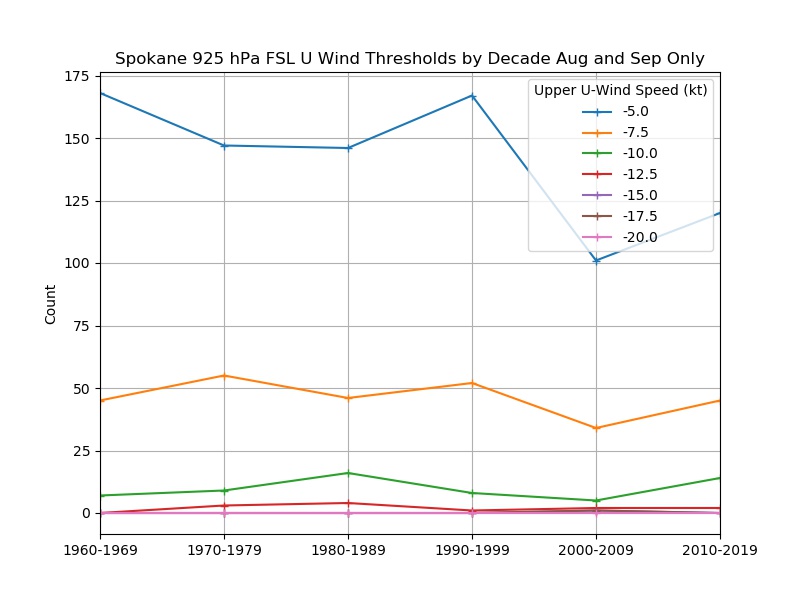
| 925 | 925 | 925 | |
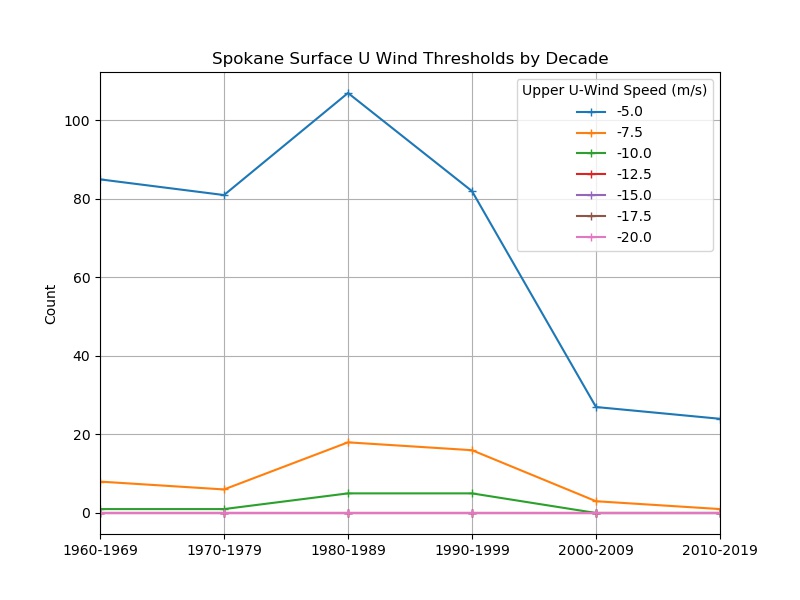
| Surface | Surface | Surface | |
| loop all | loop all | loop all | |
| All Sites | at 850 hPa | at 850 hPa |