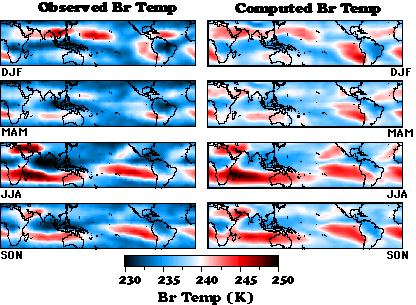
Fig 1. Seasonal Mean observed and computed brightness temperature patterns in 1989.

Predictions of the net climate response to anthropogenic carbon dioxide are highly dependent upon how water vapor processes are modeled at different layers in the atmosphere. The influence of sea surface temperature on moisture is fairly direct in the lower troposphere where moisture evaporates from the surface and is distributed through the boundary layer by shallow convection. However, the Earth's radiation balance is also sensitive to the relatively small amounts of water vapor in upper troposphere (Arking, 1990; Shine and Sinha, 1991). In the subtropics, large-scale descent suppresses deep local convection, isolating the upper troposphere from the sea surface immediately below, and the vertical transport of moisture is downward (Piexoto and Oort, 1993). Thus, the mechanisms controlling upper-tropospheric moisture are not confined to a single vertical column, but involve planetary scale circulations and horizontal transport over great distances. Consequently, many researchers have recently probed the way GCMs depict upper-tropospheric hydrology and particularly its response to climate forcing (Sud and Molod, 1988; Lindzen, 1990; Del Genio et al., 1991). Given the sensitivity of the climate to upper-tropospheric water, it is essential that GCM upper-tropospheric hydrology be tested and improved by comparison with observations. Since the radiosonde measurements of moisture above 500mb are scarce and of poor quality, the upper-tropospheric moisture generated in a data assimilation GCM are far more dependent upon the modeled hydrology than on the assimilated observations. Thus deficiencies in the GCM parameterizations may lead to large errors in the moisture field.
In this paper, the TOVS radiance observations in the 6 to 7 um water vapor band are used to evaluate the upper tropospheric moisture analyses generated by the recent 5-year run of Goddard EOS (GEOS) data assimilation system. Comparisons are made directly between the observed brightness temperature and brightness temperatures computed from the model moisture and temperature fields. In earlier studies, we have used the TOVS data to evaluate the upper tropospheric moisture in the ECMWF analyses (Salathé and Chesters, 1995) and a 10-year run of the GLA GCM (Salathé et al, 1995). The ECMWF analyses accurately capture the spatial patterns of upper tropospheric moisture, but not the strong regional moisture contrast that is indicated by satellite observations. The GLA GCM shows some success generating the observed moisture climatology. It does not yield as accurate a spatial distribution of moisture, as the ECMWF analyses, but can generate much stronger gradients between moist and dry regions.
2. Data
TOVS radiance data are archived by NOAA as idealized nadir-viewing clear-sky brightness temperatures after applying corrections to the raw observations for satellite view angle and cloud contamination. (see Chesters and Sharma, 1992 and Salathé and Chesters, 1995). The brightness temperatures presented here are a linear combination of the TOVS 6.7 and 7.2 um channels used to enhance the sensitivity to the upper-most levels of the water vapor profile. The peak sensitivity of the composite brightness temperature is at 300 mb; thus, it serves as a better indicator of upper-tropospheric moisture and more rigorous test of model predictions than the 6.7 mm channel alone. The composite brightness temperature used here will be referred to simply as the TOVS brightness temperature. To create daily images, the data along the satellite sub-orbital swaths were placed on a polar stereographic grid using the NOAA objective analysis, and then interpolated to a 5[[ring]]x5[[ring]] rectangular grid from 40S to 40N. In gridding the archived TOVS brightness temperatures, some daily images were unrecoverable or were discarded due to a lack of observations over more than 25% of the globe; approximately 6% of the data are missing or unacceptable (see Chesters and Sharma (1992) for details). Monthly and seasonal averages are obtained from the remaining quality-controlled images.
To compute brightness temperatures corresponding to the TOVS observations, we performed radiative transfer calculations on the daily data using a narrow band molecular absorption model . Given the uncertainties in the radiative transfer calculations, the mean difference between computed and observed brightness temperatures cannot be interpreted as a bias in the modeled moisture. However, the comparison of computed and observed brightness temperatures is, however, a reliable means for testing the temporal and spatial variability of the modeled moisture.
The GEOS analyses are from the GEOS-1 5-year (1985-1989) data assimilation run. Brightness temperatures are computed using the temperature and moisture profiles on the 2deg.x2.5deg. horizontal and 18-level GEOS grid. The brightness temperatures are then interpolated to the 5deg.x5deg. TOVS grid for comparisons.

Fig 1. Seasonal Mean observed and computed brightness temperature patterns in 1989.
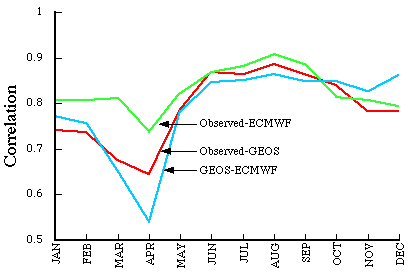
Figure 1 shows the 5-year seasonal means of observed brightness temperature, which may be compared to the computed brightness temperature fields in Fig 2. Red areas indicate regions of high brightness temperature where the upper troposphere is very dry. Blue areas indicate moist upper troposphere. The GEOS brightness temperatures are on average 2.2K higher than observed, but this bias reflects uncertainties in the radiative transfer, and does not imply the model is too dry. The analyses capture the overall placement of the seasonal moisture patterns quite well. The success in data void regions (e.g. the eastern Pacific) indicates that the model generates reasonable moisture patterns unaided by assimilated moisture data. However, the simulated moisture field is rather diffuse compared to the observed field; the gradient between very moist and very dry regions is much weaker in the simulated moisture than the observations indicate.. This character of the simulated moisture field is similar to results from the ECMWF analyses (Salathé and Chesters 1995, Soden and Bretherton, 1994). The spatial correlation of the monthly-mean brightness temperature patterns from the observations, the GEOS analyses, and the ECMWF analyses (Fig 2.) show that for most of 1989, there is little difference in how well the two analyses match the observations.

Fig 2. Correlation of observed and computed brightness temperature patterns in 1989.
Arking, A., 1990: Feedback processes and climate response. Climate Impact of Solar Variability, NASA Conf. Publ. 3086, K. H. Shatten and A. Arking (Eds.), NASA, Washington DC., p219-226.
Del Genio, A. D., A. A. Lacis, and R. A. Ruedy, 1991: Moist convection and water vapor feedback on climate. Nature, 351, 382-385.
Chesters, D. and O. Sharma, 1992: An Atlas of Upper Tropospheric Radiances Observed in the 6 to 7 Micrometer Water Vapor Band Using TOVS Data from the NOAA Weather Satellites During 1979-1991. NASA Technical Memo 104563, Goddard Space Flight Center, Greenbelt, MD., 183pp.
Lindzen, R.S., 1990: Some coolness concerning global warming. Bull. Amer. Meteor. Soc., 71, 288-299.
Peixoto, J. P. and A. H. Oort, 1992: Physics of Climate. American Institute of Physics, 520pp.
Salathé, E. P. and D. Chesters, 1995: Seasonal and regional variability of moisture in the upper troposphere, as inferred from TOVS satellite observations and ECMWF model analyses. J. Climate, 8, 120-132.
Salathé, E. P., D. Chesters, and Y. C. Sud 1995: Evaluation of the upper-tropospheric moisture in a general circulation model using TOVS satellite observations. J. Climate, submitted.
Shine, K. P. and A. Sinha, 1991: Sensitivity of the Earth's climate to height-dependent changes in the water vapour mixing ratio. Nature, 354, 382-384.
Soden, B. J. and F. P. Bretherton, 1994: Evaluation of water vapor distribution in general circulation models using satellite observations. J. Geophys. Res., 99, 1187-1210.
Sud, Y. and Molod, 1988: The roles of dry convection, cloud-radiation feedback processes and the influence of recent improvements in the parameterization of convection in the GLA GCM. Mon. Wea. Rev., 116, 2366-2387.
 Return to Eric Salathé,'s WWW Page
