Abstract: It is shown that the distribution of upper-tropospheric humidity (UTH) in the cloud-free tropics can be simulated with a simple model in which air expelled from moist convective regions is dried by subsidence along its trajectory. The distribution of UTH is analyzed in the tropical eastern Pacific using moisture data retrieved from GOES 6.7 mm observations during September 1992. The analysis examines the variation in moisture along horizontal trajectories derived from ECMWF wind analyses. Trajectory analysis is used to trace the convective sources of subtropical air. For the eastern subtropical Pacific, convective sources lie entirely outside the dry region, and are predominately in the ITCZ and over South America, with some air tracing to midlatitudes. The analysis also shows that, over large parts of the eastern subtropical Pacific, air has advected horizontally for five or more days since exiting convection. Composites of many trajectories from specific source regions show that radiatively driven subsidence appears to control the decrease in relative humidity away from convection. The observed UTH distribution along trajectories is then simulated with a simple model of horizontal advection and subsidence of an initial convective moisture profile. Finally, the monthly mean horizontal distribution of water vapor is simulated using this model of moisture transport and the computed distribution of the mean time since air at any location was in a convectively active region.
Deep convection transports moist air from near the ocean surface to the upper troposphere. The air that enters the large-scale flow from the convective regions is nearly saturated, carries hydrometeors, and is the source of moisture to the surrounding convectively inactive atmosphere. As the air flows horizontally into the subtropics, it cools radiatively and subsides. Thus, the distribution of moisture away from convective systems is established by the outflow and hydrometeor transport from the convection and by the subsequent subsiding motion. Eventually, the air will mix with other deep or intermediate convective systems, enter extra-tropical systems, or descend into the boundary layer. Where the time between convective mixing events is short, the humidity will be determined by the convective events and the moist processes associated with them. When the air is isolated from convection for long periods, the evolution of the humidity profile depends more on the horizontal transport and subsiding motions. Air is also transported into the upper-levels of the subtropics by midlatitude systems, and air from midlatitudes would have a very different moisture and hydrometeor profile from air processed by tropical convection.
Sun and Lindzen (1993) examined the distribution of tropical upper-tropospheric moisture and formulated a model of the distribution based upon moistening by hydrometeors and dissipating clouds. They determine the moisture at any location by the nearby upper-level cloud cover, explaining the decrease in moisture away from the inter-tropical convergence zone (ITCZ) by the reduced frequency of high clouds. The conceptual model used by Sun and Lindzen assumes air at mid-levels subsides directly from a thin cumulus detrainment layer between 200 mb and the tropopause. If specific humidity is conserved during the descent from 200 mb, then midlevel air would be much drier than is observed, and Sun and Lindzen require a hydrometeor moisture source to account for the deficit. However, as we discuss below, the outflow from convective regions is not restricted to a narrow layer just below the tropopause, but occurs over a deeper layer established by the dynamics of entire mesoscale convective systems. For example, Betts and Albrect (1987) argue that the air just above the convective boundary layer in the subtropics subsided from just above the freezing level. Thus, horizontal advection of air from lower, more moist, levels within tropical convection may provide an additional source of moisture to the subtropical free troposphere.
Udelhofen and Hartmann (1995) imply the importance of horizontal advection in their study of the relationship between clouds and tropical moisture using geostationary satellite data. They found that the relative humidity drops rapidly with distance from deep convective cloud systems. The relationship between humidity and distance to the nearest cloud edge showed a strong geographical dependence, with the most rapid decrease found in regions of suppressed convection. Udelhofen and Hartmann explain this geographical variation in terms of the varying depth of convective systems in the ITCZ region and subsidence region. Moisture injected into the large-scale flow by shallow convection in the subsidence region will be at a lower altitude and subside out of the upper-tropospheric layer more quickly than moisture injected quite high into the layer by deep tropical convection. Thus, Udelhofen and Hartmann argue that the horizontal influence of convective systems depends upon the height of the systems.
A common aspect of these explanations for the horizontal variation of subtropical moisture is that the moisture depends upon the frequency (Sun and Lindzen) or depth (Udelhofen and Hartmann) of nearby convection. In the present study, we take a different approach whereby we allow that convective activity is rare over large regions of the subtropics and that air in these regions has its moisture source primarily in tropical convection over the ocean or land or in midlatitude systems that may be thousands of kilometers and several days away. Furthermore, as noted by Betts (1990), the motions that control the subtropical moisture follow swirling paths such that perpendicular tracks from the source or a zonally averaged Hadley cell cannot adequately reflect the transient dynamics and processes that establish the subtropical moisture distribution. We shall examine the evolution of tropical moisture in the outflow of convective systems by examining the trajectories of air as it flows from the tropical source into the subtropics. By averaging data at similar locations along trajectories, the composite moisture behavior can be examined in a new way.
We are concerned with large-scale processes and motions on a 250 km horizontal scale (i.e. a GCM gridbox) and 12-hour time intervals rather than the scale of a single cumulonimbus. While a single towering cumulonimbus detrains mostly near the tropopause, it is not the only convective process of importance. At this time and space scale, the influence of the full range of convective clouds and, in particular, mesoscale convective systems and their full life-cycle are the important processes determining the vertical moisture distribution in convectively active regions. Mesoscale convective systems contain convective cells of various depths and stages of development with detraining tops throughout the vertical range of the troposphere. Furthermore, as the mesoscale system develops, a thick region of stratiform precipitation forms around the convective towers, which moistens a deep and broad region of the upper troposphere (Houze, 1993; Lau et al., 1993). The heating and vertical motion fields associated with convective systems is quite varied, with peak upward velocities occurring at any level above 3 km in the convective region and at various levels above the freezing level in the stratiform region (Houze, 1989). To the extent that the heating and vertical motion fields control the horizontal divergence and outflow from the convective system, these results indicate that moisture is being supplied at all levels in the upper troposphere.
Soden and Fu (1995) show that high upper-tropospheric humidity is associated with more frequent convection. Thus, convective activity tends to create and maintain high levels of humidity above 500 mb.We expect the moisture in convectively active regions will differ from the moisture in regions where the air has been isolated from convection for a day or more. Trajectory analysis will composite observations according to their history of convective activity, and allow a detailed examination of the relationship between convective regions and the dry regions they influence.
Sherwood (1996) computed the terms in the moisture budget from the ECMWF analyzed winds and humidity, and compared the importance of horizontal and vertical transport and of additional sources in the clear subtropics. The results show that horizontal and vertical advection are of nearly the same magnitude above 500 mb, and that any additional source is relatively small.
The moisture data we will use are the upper tropospheric humidity (UTH) retrieved from GOES satellite observations at 6.7 mm (Udelhofen and Hartmann, 1995). The satellite data provide information on the mean humidity over a broad layer from 500 to 200 mb, which we will refer to as the UTH layer. We cannot consider the effects of vertical variations in advection within this layer, and consequently we take the simplified view that the horizontal outflow from convective regions is vertically uniform above the base of the UTH layer (i.e., from 500 mb to the tropopause). Thus, we assume an air column exits a region of deep convection and advects and subsides uniformly. This simplified picture neglects the increased large-scale winds driven by convective detrainment near the tropopause and diminished winds near 500 mb, but we feel it is sufficient to understand the effects of horizontal advection on free-tropospheric moisture as portrayed in the data. We make this assumption not only for the sake of simplicity; it is required by the humidity observations, which cannot reveal vertical moisture variations within the UTH layer.
We begin by describing the data used in the study, which include satellite data for moisture and cloud fields and European Centre for Medium Range Weather Forecasts (ECMWF) analyses for temperature and winds. We will then develop a trajectory analysis that will establish the moisture sources and time between convective injections following the air flow. This analysis will justify the assumptions regarding the long time and distance that separates subtropical air from its sources. We will then use the trajectory analysis to create composites of the moisture structure as air flows out of convective regions. The trajectory analysis illustrates the effects of horizontal advection and subsidence on the moisture distribution.
Cloud information for this study is also taken from GOES IR channel observations. Above the high clouds (500 mb or higher) that we are concerned with, the atmosphere is essentially transparent at 11 mm and the IR channel brightness temperature can be taken as the cloud top temperature. The GOES observations are over a 4 km square so that a pixel filled with scattered clouds smaller than 4 km will not accurately reflect the cloud top temperatures. For convectively active regions in the tropics, however, it is reasonable to assume that spreading nimbostratus regions will fill the pixel and the brightness temperature will indicate the cloud temperature.
Horizontal and vertical wind, height, and temperature data are taken from the ECMWF operational analyses. In order to combine the GOES and ECMWF data, the satellite data were averaged over each 2.5x2.5 degree grid box of the analyses. Cloud fraction at a given pressure is the fraction of satellite pixels in a gridbox where the 11 mm brightness temperature is less than the ECMWF temperature at that level. Since the brightness temperature only gives information about the cloud top, if the cloud is vertically thin, it may be entirely above the pressure level; thus the cloud fraction at a pressure level is the fractional area with cloud tops above that level. In the tropics, the percent high cloud gives a good indication of the convective activity over a region. A cloud top temperature of 235 K is a typical threshold for deep convection (Chen et al., 1996), which over the tropics corresponds roughly to a 300 mb cutoff. Thus, we will use the 300 mb cloud fraction derived from the GOES-IR data as an indicator of deep convection. This parameter is equivalent to percent high cloudiness used, for example, in Chen et al. (1996) and similar to the frequency of deep convection used by Soden and Fu (1995).
To derive humidity on the ECWMF grid from the satellite data, we average the GOES-UTH from clear-sky (above 700 mb) pixels within each gridbox. In partially cloudy gridboxes, the average reflects the moisture in the clear environment of deep convection. Assuming 100% humidity for the cloudy pixels would overestimate the humidity of the convective environment since many of the cloudy pixels are over spreading anvils that mask a drier region below. Likewise, clear air above a 700 mb cloud top could be quite dry. Throughout this paper, UTH will be an abbreviation for the clear-sky satellite-derived 500-200 mb humidity on the ECWMF grid. We will use 0 and 12 UTC data over the eastern tropical pacific for September 1992. This region and period are well suited for the study of subtropical moisture. The ITCZ is well established and stable during September (e.g. Waliser and Gautier, 1993) and therefore provides a predictable convective source for upper level moisture. The South American continent is also included in the region, which will allow us to compare the moisture coming from oceanic and continental convection.
While averaging the satellite data over the ECMWF grid-box loses the mesoscale information available in the satellite data, we are not concerned with moisture variation on such small scales in this study. Rather than probing the moisture structure between closely spaced convective systems, we will examine the affect of large regions of convection on the large-scale moisture distribution over the tropical eastern Pacific.
|
|
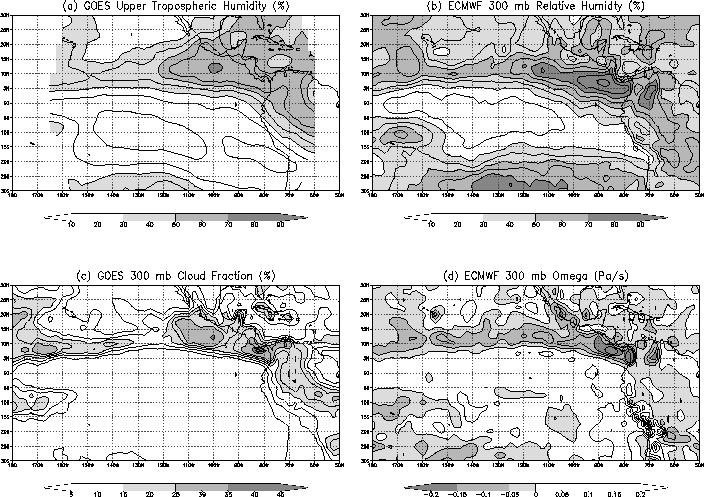
| Fig 1. September 1992 averages of data used in this paper. a) Upper tropospheric relative humidity derived from GOES 6.7 mm observations. b) 300 mb relative humidity from ECMWF analysis. c) Percent cloud fraction above 300 mb derived from GOES 11 mm observations. d) Vertical motion from ECMWF analysis. |
|
| Fig 2. Comparisons among satellite and ECMWF data; each point represents a value from a single gridbox and time. The solid (dashed) lines are averages of the data within even increments of the horizontal (vertical) coordinate. |
|
| Fig 3. Zonal mean relative humidity and moisture flux using satellite UTH and ECMWF winds |
|
| Fig 4. Comparison of 300 mb cloud fraction and UTH. a) 300 mb cloud fraction is averaged over the convectively active region and UTH is averaged over the subsidence region indicated by boxes. b) Time series of cloud fraction (solid) and UTH (dashed). c) Correlation of these time series with UTH lagging cloud fraction. |
Examining Fig. 3 shows that moisture convergence occurs near 10 S within the minimum of zonal mean relative humidity. Likewise, there is moisture divergence at 20 N, near the zone of maximum relative humidity. Thus, at upper levels, the large-scale flow transports moisture away from the moist tropical band and into the upper levels of the subtropics as we would expect.
To illustrate the transport of moisture from deep convection into non-convective regions, we can compare the cloud fraction averaged over a convective region (Fig. 4a, upper box), with the UTH averaged over a nearby subsidence region (Fig. 4a, lower box). Air parcels originating in the convective region flow into the subsidence region during the one month period of September 1992 (see Fig. 6 and trajectory analysis below). The time-series of cloud fraction in the convective region and of UTH in the subsidence region are shown in Fig 4b. The time period of the data is quite short compared to the variation of these quantities, and a definitive relationship cannot be made. Nevertheless, it is clear that the troposphere becomes more moist downstream of convection in response to increased convective activity. The correlation is greatest when UTH lags cloudiness by about 1.5 days (Fig 4c). With a wind speed of 103 km/day, this lag is roughly the travel time between the two regions. This connection between moisture and convection is consistent with the results of Soden and Fu (1995), who find a pointwise correlation between deep convection and upper-tropospheric humidity even as the two fields are averaged over increasingly larger spatial domains.
We define convective regions as gridboxes with more than 15% cloud cover, which distinguished gridboxes where convection is actively conditioning the moisture profile. Rather than conceiving of fixed convective regions (e.g. the ITCZ) that pump air from low-levels to the upper-troposphere, we consider convective systems as intermittent events imbedded in the large scale flow that mix the air column and establish a vertical humidity profile according to the various convective and mesoscale dynamics within the convectively active grid-box. Whether the upper-tropospheric air is expelled out of a stationary convective system or the convective system moves with the flow and dissipates is not important to our analysis except that the upper-tropospheric layer is assumed to move uniformly. Since there is increased outflow from convection at higher levels, and since specific humidity decreases with height, the assumption that the outflow is uniform with height over-estimates the amount of water transported to the large-scale flow. The implications of this over-estimate is discussed in the final section.
|
| Fig 5. Comparison of 300 mb cloud fraction and UTH. a) 300 mb cloud fraction is averaged over the convectively active region and UTH is averaged over the subsidence region indicated by boxes. b) Time series of cloud fraction (solid) and UTH (dashed). c) Correlation of these time series with UTH lagging cloud fraction. |
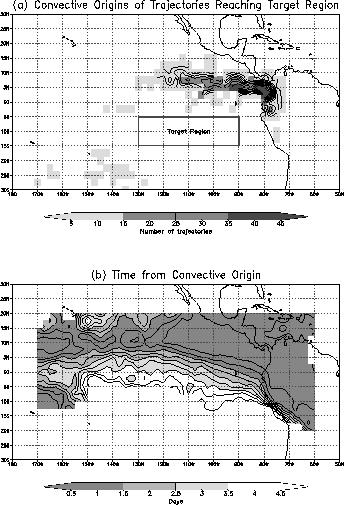
We identify three tropical source regions that will be the basis of the analysis in the next section: tropical oceanic convection associated with the ITCZ, tropical land convection over South America, and extra-tropical systems (i.e., points south of 15 S and west of 130 W in Fig. 5a). The cloud systems referred to as extra-tropical appear to be either associated with the South Pacific Convergence Zone (SPCZ) or the equatorward edges of midlatitude storms. It should be noted that no trajectories from this region encountered grid boxes containing 15% cloud cover within the dry subtropical region. Thus, the significant cloud systems that provide moisture to the subtropics lie entirely outside the region.
The path from the convective source is not direct, thus the time and distance the air travels since leaving its source is much greater than one would infer from Fig. 5a assuming typical tropical wind speeds and a direct path. By taking back trajectories from all points in the region and tallying the number of days until a convective gridbox is reached, we can find the average time air at each point has traveled from its source. This result is shown in Fig. 5b. Trajectories were computed for all points within 20 degrees of the Equator. Uncontoured regions indicate points where fewer than 25% of the trajectories found a source. Since potentially 75% of the trajectories at a gridpoint may not have found a source, these results are a lower bound to the actual time to the trajectory source. Thus, over most of the subtropical eastern Pacific, air has not been processed by convection for 3 to 6 days or more. Along the ITCZ (located at about 10 N) and over the tropical land areas, the air spends little or no time outside convection. Note that the target region in Fig. 5a is mostly blank in Fig. 5b. As discussed above, a large fraction of points in this region did not find a convective source within 7 days, and so were excluded by the 25% threshold.
We can also interpret Figure 5b as indicating the areas of the tropics that are actively influenced by convection and those that are isolated from convection. Regions where air parcels are on average a day or less away from a convective source are convectively active. In these regions, the moisture distribution should reflect recent moisture injection by convective systems. Regions where air parcels have been away from deep convection for more than a day are convectively inactive. The moisture distribution in these regions may have evolved considerably from that in the vicinity of active convection. This partitioning gives a different view of the relationship of moisture to convection than composites based on instantaneous local values of sea-surface temperature or OLR. In our Lagrangian partitioning scheme, the influence of convection is based on the actual history of tropical air parcels.
Trajectory analysis reveals the principal deep convective regions that are sources of subtropical moisture and the amount of time air parcels spend isolated from convection. The source regions are distant from the dry subtropics, and the dry air is isolated from the convective source for 3 to 6 days or more. Assuming a typical subsidence rate of 35 mb/day, this yields a net vertical descent of 100 to 200 mb.
|
| Fig 6. Examples of forward trajectories computed with origins in the ITCZ region. Each trajectory path is marked by a letter, with a capital letter at the origin. Cloudy trajectory points are marked by a dot. |
Note that the 500-200 mb specific humidity is not conserved along the horizontal trajectory. As air advects horizontally, it is displaced vertically so that air parcels will pass into or out of the UTH layer that is observed by the satellite. Additionally, hydrometeors may precipitate into the UTH layer from thin cloud layers near the tropopause. Thus, the trajectory analysis is not a three-dimensional Lagrangian depiction of the moisture transport, but is rather a means of establishing a horizontal coordinate according to the actual motions of the air as it flows from convection into the subtropics.
Vertical displacement is the integrated vertical velocity along the trajectory. The vertical displacement is smaller than the layer thickness, and is treated as a parameter along the trajectory rather than as modifying the trajectory. Vertical velocities from the ECMWF analyses are quite noisy and do not correspond well to the satellite data. The balance of radiative cooling and heating from adiabatic descent largely determines the vertical motion in clear regions of the tropics. If h is the radiative heating rate and Sp is the static stability, then the vertical velocity (in pressure coordinates) is . Using this relation, we can estimate the diabatic vertical velocity from the satellite-derived UTH. We compute the heating using the ECMWF temperature profile with a moisture profile that combines the UTH value between 500 and 200 mb with the ECMWF moisture profile elsewhere. The computation uses the NCAR CCM2 column infrared and solar radiation models (Hack et al., 1992) and diurnal mean insolation. The static stability Sp at upper levels in the tropics is quite uniform and does not vary in a consistent way along trajectories, thus a tropical mean value of 0.05 K mb-1 is used. The following analysis is performed using both ECMWF and diabatic vertical velocities.
A large sample of forward trajectories are generated by scanning each 12-hourly 300-mb cloud fraction field for gridboxes containing greater than 15% cloud cover. Trajectories are followed only for cloudy gridpoints where the adjacent downwind gridbox is clear. The origin of the trajectory is the last point before the trajectory passes from a cloudy to a clear gridbox. Frequently, the convective region moves with the flow and the trajectory does not exit the convective region in the first time step. The trajectory terminates if it re-enters a cloud or continues for more that 5 days.
Figure 6 shows an example of trajectories for 15 September using 500-200 mb mean winds. Each of these trajectories is classified as originating in the ITCZ region and entering the South Pacific. Note that the paths are curved and often cross so that without the trajectories it would be impossible to properly associate points with the appropriate motion from its source.
|
| Fig 7. Results of the forward trajectory analysis. Trajectories originating in each region are composited according to the parameter on the horizontal axis of each panel. In b) ECMWF vertical motion is used to compute vertical displacement; in d) the diabatic vertical velocity is used. Solid dots in d) are theoretical values as discussed in section 5. |
The variable relationship between UTH and distance results in part from the horizontal scale of various descending trajectories. Depending upon the wind speed and rate of descent, air originating near the tropopause in the convective region will enter the UTH layer at various horizontal distances, as shown in Fig. 8. One way to account for this effect is to
|
| Fig 8. Schematic diagram of how horizontal and vertical advection control the movement of air into the 500-200 mb layer where the satellite-derived UTH is observed. The horizontal coordinate is distance along the curved trajectory path. |
The diabatic velocity gives a clearer picture. Since this velocity is computed from the radiative heating, first consider how radiative cooling changes along trajectories. Fig. 7c shows the average net radiative heating along trajectories as a function of distance along the trajectory. Air cools uniformly along all trajectories after exiting convection. The heating becomes increasingly variable at larger distances, again indicating the variable horizontal scale of the trajectories. The cooling is much slower for the air from extra-tropical source regions as a result of the much drier profile. Since all air columns are in the tropics, despite their origin, their temperature profiles are similar and differences in heating rate are mostly due to humidity differences.
Figure 7d shows the variation of UTH along trajectories where data have been composited according to vertical displacement computed from the diabatic vertical velocity. The top axis indicates the net heating assuming a uniform value of Sp = 0.05 Kmb-1 over the tropics. These composites give a much smoother representation than using the ECWMF vertical velocity (Fig 7b). UTH varies more consistently with vertical displacement than with horizontal displacement (Fig 7a). Differences among regions are about 10 percentage points, which is slightly larger than the standard deviation of the average for the composite. The two composites of trajectories originating in the ITCZ (for northward and the southward trajectories) differ by much less than their uncertainties. The composite of trajectories from continental convection over South America is quite similar to the ITCZ composites, but becomes dry a bit more quickly. The composites of trajectories from extra-tropical convection is uniformly drier than the results for tropical sources. For a given source, the moisture variation along trajectories is determined by the vertical displacement regardless of the path the air takes from the source. Air from a different source regions, however, yields different moisture patterns even though trajectories from each source region converge in the East Pacific.
This explanation assumes that the moisture transport outside convection is controlled by horizontal and vertical advection without additional sources. Sun and Oort (1995) show that the humidity in the tropics does not increase with temperature at a sufficient rate to maintain constant relative humidity except at the very highest levels and in the boundary layer. This observation suggests that local moisture sources are important at the top and bottom, such as hydrometeors and shallow convection, but that in the bulk of the troposphere, humidity is not related to local thermodynamics. Likewise, Sherwood's (1996) moisture budget calculations based on the ECMWF analyses shows that any moisture source in the subtropics is much smaller than vertical or horizontal advection. Thus, in the absence of sources, the moisture advection can be expressed as
Equation (1) can now be used to predict the horizontal variation of moisture away from tropical convection from the solution


|
| Fig 9. Relative humidity profiles for simulation of subsidence induced drying. The solid line is RH with respect to water, and the dashed is with respect to ice. The initial profile is constant relative humidity of 85% and profiles for each increment of vertical displacement proceed to the left. |
In (1), we have assumed, as in the trajectory analysis, that the motions are uniform with height. A problem with this assumption can be seen in Fig. 9; unless more air is supplied to the large-scale flow at the tropopause, the subsiding motion would cause the highest tropospheric air, and hence the tropopause, to descend unrealistically rapidly as the air moves into the subtropics. This is not a significant problem in this analysis as we do not follow the subsiding motion long enough to take the tropopause into the UTH layer, but clearly, this simple model does not describe the full nature of tropical motions. We do believe, however, that this description illustrates the horizontal transport of moisture along a subsiding trajectory.
The parameter P in the above discussion is equivalent to the horizontal axis in Fig 7d, Total Subsidence. Vertically integrating the humidity profiles in Fig. 9 yields UTH at each 20-mb increment in P, and these values are plotted as dots over the observed relationships in Fig. 7d. The result matches quite well to the observed UTH variation from tropical convection sources. The shape of the curve is not sensitive to the shape of the initial moisture profile; provided the initial UTH value is the same, similar results are obtained by reducing the moisture above 350 mb and increasing below. Thus, by way of (1), the subsidence determines the horizontal variation of UTH given a particular convectively induced initial moisture profile.
The observed curves appear to flatten out at large subsidence, whereas the simulated curve continues to dry. The observed values for large subsidence, however, are quite far along the trajectories, and the trajectories are unlikely to be valid at this extreme. Note that the extra-tropical curve flattens for smaller subsidence, which results from slower subsidence rate for these trajectories (see Fig 7c) and the distance and time along the trajectory is farther for smaller subsidence. The UTH curve for midlatitude sources does not match the computed curve, evidently because the initial moisture profile produced by midlatitude cloud systems is much drier than that of tropical cloud systems. A drier initial humidity profile will produce a UTH curve that matches the extra-tropical results until the observed curve flattens out while the simulated curve continues to drop.
In discussing the variation of moisture along trajectories, we have not addressed the horizontal distribution of tropical tropospheric moisture. The geographical UTH pattern can be inferred from Fig. 7d if one knows the geographical pattern of total subsidence. Total subsidence at a given location is the net vertical displacement of air reaching that point since it exited a convective region. If we assume a uniform subsidence rate or 35 mb/day, the monthly mean displacement can be related directly to the mean time air has travelled from convection, which is shown in Fig. 5b. Thus, the mean time from convection in 5b is multiplied by 35 mb/day to obtain mean subsidence. This value corresponds to the horizontal axis of Fig. 7d, and the UTH value can be taken directly from the theoretical curve to simulate the horizontal UTH distribution (Fig 10, top).
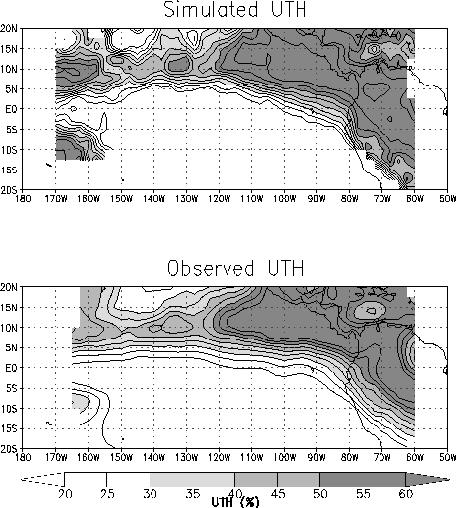
|
| Fig 10. Comparison of simulated (top) and observed (bottom) UTH. |
We repeated the moisture analyses presented above using the ECMWF relative humidity and the satellite-derived cloud field, which yields poor results. It is not reasonable to expect the ECMWF model to produce the precise location and details of tropical convection over data-void regions. Thus, applying the satellite-derived convection as moisture sources cannot yield the modeled moisture even if the model correctly advects moisture from convective sources. Given the relatively simple description of how moisture varies outside of tropical convection, we expect that the model UTH field would be consistent with an analysis based on a model-derived convective source. Alternatively, if advances in data assimilation and convective parameterization allow the model to accurately depict the strength and distribution of convection, it would likely capture the horizontal moisture distribution in the surrounding clear areas.
In a similar study Udelhofen and Hartmann (1995) found a very rapid decrease in UTH distance from the nearest cloud edge. The current results show that UTH decreases much more slowly away from clouds when one considers the trajectory path and source cloud for dry air columns. In part, the slower reduction in UTH is from air not moving perpendicularly away from cloud systems, and possibly also from the cloud system moving along with the air after it leaves the cloud or air moving into cloud systems and not out. In the present analysis, we separate trajectories by their source region, even though air from South American and ITCZ convective systems both flow into the same region. In considering both UTH and clouds within the dry subsiding region, Udelhofen and Hartmann isolate the effect of shallower less active convection that transports relatively little moisture to the upper troposphere. Moisture injection by shallow clouds in the subsidence region, as described in Udelhofen and Hartmann (1995), may explain the flattening of the UTH curves at large vertical displacement (Fig 7d). Such a local moisture source in this region would prevent the UTH from continuing to decrease as predicted.
As in Sun and Lindzen (1993), we relate the distribution of upper-tropospheric humidity to detrainment of moisture from tropical convection. We differ by considering the effect of horizontal advection and detrainment at all levels rather than in a narrow layer near the tropopause. Moisture detrains near the tropopause to a larger degree than elsewhere in the convective systems, and we may overestimate the relative impact of air exiting the convective system at lower levels. If more dry high-level air enters the large-scale flow, hydrometeors and dissipating clouds may be necessary to account for the moisture budget of the upper troposphere. In fact, one could construct an explanation of the present results based on the precipitation of hydrometeors into the UTH layer. To be consistent with our results, however, the hydrometeors would have to originate in a very large thin cirrus layers extending thousands of kilometers downwind of convection rather than from nearby clouds as implied by Sun and Lindzen. Nevertheless, our results indicate that horizontal moisture advection is an important moisture source to the subtropics. Furthermore, understanding the full vertical structure of moisture transport and detrainment in mesoscale convective systems is critical to the moisture distribution over the entire tropics.
Pierrehumbert (1995) found that the relative areas of convective and dry subsiding regions in the tropics has an important control on the tropical energy budget. Our results show that the moisture in the dry subsidence regions is itself dependent upon the relative areas of convection and subsidence and the flow of air between them. The relative areas determine the amount of convection supplying the moisture to the subtropics and the time between convective events following an air column. As shown by Soden and Fu (1995), the more frequently deep convection occurs in a large region, the more moist it becomes. We can interpret this dependence in terms of Fig. 7d by suggesting that when deep convection is more frequent or pervasive, more air columns are restricted to the left-most portion of the curve, but when deep convection is more rare, air columns can move farther to the right along the curve.
The initial vertical profile of moisture as conditioned by deep convection apparently controls the humidity along the path of air as it flows into the subtropics. In this study, very little difference was found in the humidity along trajectories originating from the ITCZ, regardless of their destination. However, the few land-based and extra-tropical sources showed somewhat different behaviors, which is likely to be a result of the difference in vertical moisture transport by oceanic or land surface and by tropical or midlatitude convection. This analysis has not addressed the role of midlatitude systems in controlling subtropical moisture. From the back trajectory analysis, it is clear that a large fraction of the subtropical East Pacific air has its source in the midlatitudes. Thus, a full understanding the mechanisms controlling moisture in the subtropics will require a global analysis.