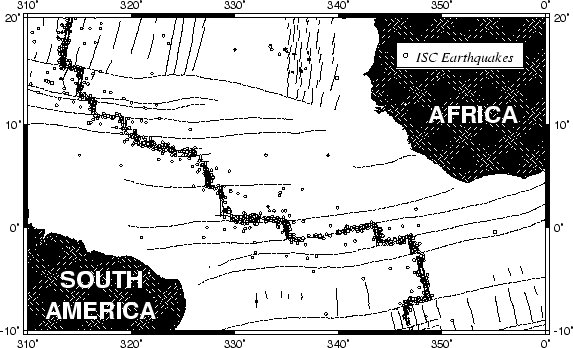
Many scientific papers start out by showing a location map of the region of interest. This map will typically also contain certain features and labels. This example will present a location map for the equatorial Atlantic ocean, where fracture zones and mid-ocean ridge segments have been plotted. We also would like to plot earthquake locations and available isochrons. We have obtained one file, quakes.xym, which contains the position and magnitude of available earthquakes in the region. We choose to use magnitude/100 for the symbol-size in inches. The digital fracture zone traces (fz.xy) and isochrons (0 isochron as ridge.xy, the rest as isochrons.xy) were digitized from available maps7.2. We create the final location map (Figure 7.7) with the following script:
#!/bin/csh
#        GMT EXAMPLE 07
#
#        $Id: job07.csh,v 1.6 2004/04/10 17:19:14 pwessel Exp $
#
# Purpose:    Make a basemap with earthquakes and isochrons etc
# GMT progs:    pscoast, pstext, psxy
# Unix progs:    $AWK, echo, rm
#
pscoast -R-50/0/-10/20 -JM9i -K -GP300/26 -Dl -W0.25p -B10 -U"Example 7 in Cookbook" >! example_07.ps
psxy -R -J -O -K -M fz.xy -W0.5pta >> example_07.ps
$AWK '{print $1-360.0, $2, $3*0.01}' quakes.xym | psxy -R -J -O -K -H1 -Sci -Gwhite -W0.25p \
   >> example_07.ps
psxy -R -J -O -K -M isochron.xy -W0.75p >> example_07.ps
psxy -R -J -O -K -M ridge.xy -W1.75p >> example_07.ps
psxy -R -J -O -K -Gwhite -W1p -A << END >> example_07.ps
-14.5    15.2
 -2    15.2
 -2    17.8
-14.5    17.8
END
psxy -R -J -O -K -Gwhite -W0.5p -A << END >> example_07.ps
-14.35    15.35
 -2.15    15.35
 -2.15    17.65
-14.35    17.65
END
echo "-13.5 16.5" | psxy -R -J -O -K -Sc0.08i -Gwhite -W0.5p >> example_07.ps
echo "-12.5 16.5 18 0 6 LM ISC Earthquakes" | pstext -R -J -O -K >> example_07.ps
pstext -R -J -O -S0.75p -Gwhite << END >> example_07.ps
-43 -5 30 0 1 CM SOUTH
-43 -8 30 0 1 CM AMERICA
 -7 11 30 0 1 CM AFRICA
END
\rm -f .gmt*
The same figure could equally well be made in color, which could be rasterized and made into a slide for a meeting presentation. The script is similar to the one outlined above, except we would choose a color for land and oceans, and select colored symbols and pens rather than black and white.