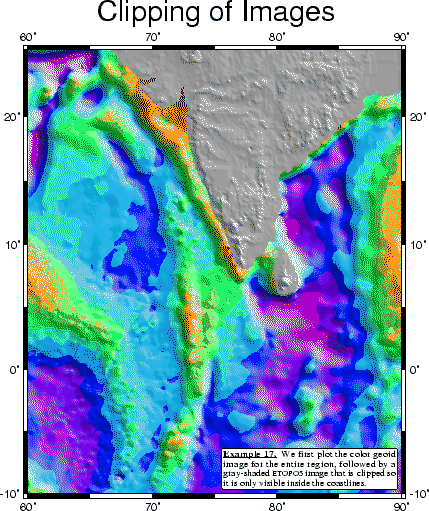
This example demonstrates how pscoast can be used to set up clippaths based on coastlines. This approach is well suited when different gridded data sets are to be merged on a plot using different color palette files. Merging the files themselves may not be doable since they may represent different data sets, as we show in this example. Here, we lay down a color map of the geoid field near India with grdimage, use pscoast to set up land clippaths, and then overlay topography from the ETOPO5 data set with another call to grdimage. We finally undo the clippath with a second call to pscoast with the option -Q (Figure 7.17):
#!/bin/csh
#        GMT EXAMPLE 17
#
#        $Id: job17.csh,v 1.2 2003/12/18 02:27:21 pwessel Exp $
#
# Purpose:    Illustrates clipping of images using coastlines
# GMT progs:    grd2cpt, grdgradient, grdimage, pscoast, pstext
# Unix progs:    rm
#
# Get Geoid and Topography for the region
#grdraster 1 -R60/90/-10/25 -Gindia_topo.grd
#grdraster 4 -R60/90/-10/25 -Gindia_geoid.grd

# First generate geoid image w/ shading

grd2cpt india_geoid.grd -Crainbow >! geoid.cpt
grdgradient india_geoid.grd -Nt1 -A45 -Gindia_geoid_i.grd
grdimage india_geoid.grd -Iindia_geoid_i.grd -JM6.5i -Cgeoid.cpt -P -K -U"Example 17 in Cookbook" \
   >! example_17.ps

# Then use pscoast to initiate clip path for land

pscoast -R60/90/-10/25 -J -O -K -Dl -Gc >> example_17.ps

# Now generate topography image w/shading

echo "-10000 150 10000 150" >! gray.cpt
grdgradient india_topo.grd -Nt1 -A45 -Gindia_topo_i.grd
grdimage india_topo.grd -Iindia_topo_i.grd -J -Cgray.cpt -O -K >> example_17.ps

# Finally undo clipping and overlay basemap

pscoast -R -J -O -K -Q -B10f5:."Clipping of Images": >> example_17.ps

# Add a text paragraph

pstext -R -J -O -M -W255O0.5p -D-0.1i/0.1i << EOF >> example_17.ps
> 90 -10 12 0 4 RB 12p 3i j
@_@%5%Example 17.@%%@_  We first plot the color geoid image
for the entire region, followed by a gray-shaded @#etopo5@#
image that is clipped so it is only visible inside the coastlines.
EOF

# Clean up

\rm -f geoid.cpt gray.cpt *_i.grd .gmt*