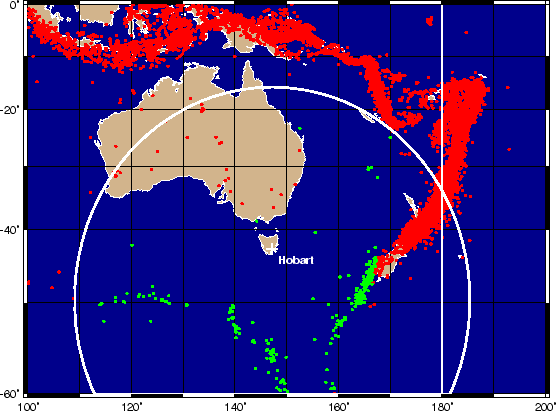
Allthough we are not seismologists, we have yet another example involving seismicity. We use seismicity data for the Australia/New Zealand region to demonstrate how we can extract subsets of data using geospatial criteria. In particular, we wish to plot the epicenters given in the file oz_quakes.d as red or green circles. Green circles should only be used for epicenters that
#!/bin/csh
#
#    GMT Example 24  $Id: job24.csh,v 1.4 2004/04/27 23:24:00 pwessel Exp $
#
# Purpose:    Extract subsets of data based on geospatial criteria
# GMT progs:    gmtselect, pscoast, psxy, minmax
# Unix progs:    echo, cat, awk
#
# Highlight oceanic earthquakes within 3000 km of Hobart and > 1000 km from dateline
echo "147:13 -42:48 3000 Hobart" >! point.d
cat << EOF >! dateline.d
> Our proxy for the dateline
180    0
180    -90
EOF
set R = `minmax -I10 oz_quakes.d`
pscoast $R -JM9i -K -Gtan -Sdarkblue -Wthin,white -Dl -A500 -Ba20f10g10WeSn \
    -U"Example 24 in Cookbook" >! example_24.ps
psxy -R -J -O -K oz_quakes.d -Sc0.05i -Gred >> example_24.ps
gmtselect oz_quakes.d -L1000/dateline.d -Nk/s -C3000/point.d -fg -R -J -Il \
    | psxy -R -JM -O -K -Sc0.05i -Ggreen >> example_24.ps
awk '{print $1, $2, 0, $3, $3}' point.d | psxy -R -J -O -K -SE -Wfat,white >> example_24.ps
awk '{print $1, $2, 14, 0, 1, "LT", $4}' point.d \
    | pstext -R -J -O -K -Gwhite -D0.1i/-0.1i >> example_24.ps
psxy -R -J -O -K point.d -Wfat,white -Sx0.2i >> example_24.ps
psxy -R -J -O -M dateline.d -Wfat,white -A >> example_24.ps
\rm -f point.d dateline.d .gmt*
The script produces the plot in Figure 7.25. Note that the horizontal distance from the dateline seems to increase as we go south; however that is just the projected distance (Mercator distortion) and not the actual distance which remains constant at 1000 km.