We have now reduced the map area by zooming in on the map center.
Now, the edges of the map are all 2000 km true distance from
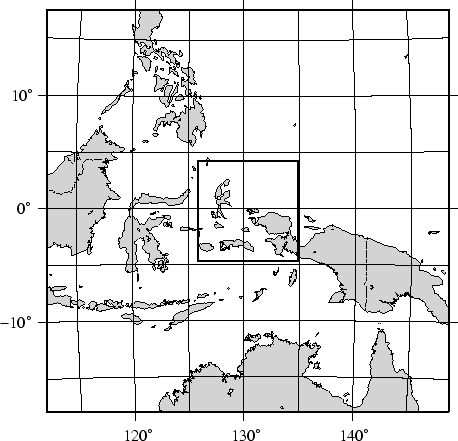
the projection center. At this scale we choose the low resolution
data that faithfully reproduce the dominant geographic features
in the region. We cut back on minor features less than 100 km![]() in area. We still add national borders to the plot. The low
database is less decimated and simplified by the DP-routine: The
total file size of the coastlines, rivers, and borders combined
grows to 876 Kbytes; it is the default resolution in GMT. The
plot is generated by the command:
in area. We still add national borders to the plot. The low
database is less decimated and simplified by the DP-routine: The
total file size of the coastlines, rivers, and borders combined
grows to 876 Kbytes; it is the default resolution in GMT. The
plot is generated by the command:
pscoast `./getbox -JE130.35/-0.2/1i -2000 2000 -2000 2000` -JE130.35/-0.2/3.5i -P -Dl -A100 \
   -Glightgray -W0.25p -N1/0.25tap -B10g5WSne -K > GMT_App_K_2.ps
./getrect -JE130.35/-0.2/1i -500 500 -500 500 | psxy -R -JE130.35/-0.2/3.5i -O -W1.5p -L -A \
   >> GMT_App_K_2.ps