 |
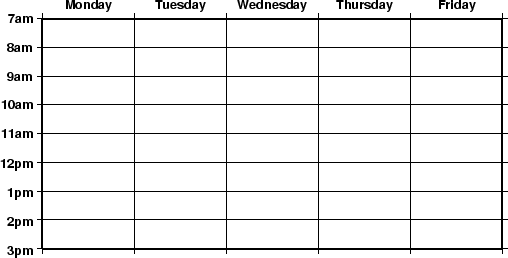
Several particular issues arise when we seek to make linear plots using calendar date/time as the input coordinates. As far as setting up the coordinate transformation we must indicate whether our input data have absolute time coordinates or relative time coordinates. For the former we append T after the axis scale (or width), while for the latter we append t. However, for command line arguments we may specify time using either absolute or relative time. An absolute time entry must be given as [date]T[clock] (with date given as yyyy[-mm[-dd]], yyyy[-jjj], or yyyy[-Www[-d]], and clock using the hh[:mm[:ss[.xxx]]] 24-hour clock format) whereas the relative time is simply given as the units of time since the epoch (see TIME_SYSTEM for information on specifying the time unit and the epoch). As a simple example, we will make a plot of a school week calendar (Figure 5.3).
gmtset PLOT_DATE_FORMAT o TIME_WEEK_START Sunday PLOT_CLOCK_FORMAT -hham TIME_FORMAT_PRIMARY full
psbasemap -R2001-9-24T/2001-9-29T/T07:0/T15:0 -JX4T/-2T -Ba1Kf1kg1d/a1Hg1hWsNe -P > GMT_linear_cal.ps