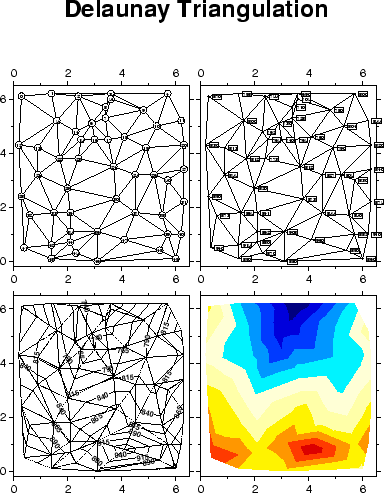
Our next example (Figure 7.12) operates on a data set of topographic readings non-uniformly distributed in the plane (Table 5.11 in Davis: Statistics and Data Analysis in Geology, J. Wiley). We use triangulate to perform the optimal Delaunay triangulation, then use the output to draw the resulting network. We label the node numbers as well as the node values, and call pscontour to make a contour map and image directly from the raw data. Thus, in this example we do not actually make gridded files but still are able to contour and image the data. We use a color palette table topo.cpt (supplied with the script data separately). The script becomes:
#!/bin/csh
#        GMT EXAMPLE 12
#
#        $Id: job12.csh,v 1.7 2004/07/14 00:46:17 pwessel Exp $
#
# Purpose:    Illustrates Delaunay triangulation of points, and contouring
# GMT progs:    makecpt, minmax, pscontour, pstext, psxy, triangulate
# Unix progs:    $AWK, echo, rm
#
# First draw network and label the nodes
triangulate table_5.11 -M >! net.xy
psxy -R0/6.5/-0.2/6.5 -JX3.06i/3.15i -B2f1WSNe -M net.xy -W0.5p -P -K -Y4.65i >! example_12.ps
psxy table_5.11 -R -J -O -K -Sc0.12i -Gwhite -W0.25p >> example_12.ps
$AWK '{print $1, $2, 6, 0, 0, "CM", NR-1}' table_5.11 | \
   pstext -R -J -O -K >> example_12.ps
# Then draw network and print the node values
psxy -R -J -B2f1eSNw -M net.xy -W0.5p -O -K -X3.25i >> example_12.ps
psxy -R -J -O -K table_5.11 -Sc0.03i -Gblack >> example_12.ps
$AWK '{printf "%g %s 6 0 0 LM %g\n", $1, $2, $3}' table_5.11 | pstext -R -J -O -K -W255o \
   -C0.01i/0.01i -D0.08i/0i -N >> example_12.ps
# Then contour the data and draw triangles using dashed pen
# Use "minmax" and "makecpt" to make a color palette (.cpt) file
set z = `minmax table_5.11 -C -I25`
makecpt -Cjet -T$z[5]/$z[6]/25 >! topo.cpt
pscontour -R -J table_5.11 -B2f1WSne -W0.75p -Ctopo.cpt -L0.25pta -G1i/0 -X-3.25i -Y-3.65i -O -K \
   -U"Example 12 in Cookbook" >> example_12.ps
# Finally color the topography
pscontour -R -J table_5.11 -B2f1eSnw -Ctopo.cpt -I -X3.25i -O -K >> example_12.ps
echo "3.16 8 30 0 1 BC Delaunay Triangulation" | pstext -R0/8/0/11 -Jx1i -O -X-3.25i >> example_12.ps
#
\rm -f net.xy topo.cpt .gmt*