![[Live from Earth and Mars]](http://www-k12.atmos.washington.edu/k12/graphics/xmars_map.gif.pagespeed.ic.Bwqa4QZhmw.png)
![[Live from Earth and Mars]](http://www-k12.atmos.washington.edu/k12/graphics/xmars_map.gif.pagespeed.ic.Bwqa4QZhmw.png)
Temperature overview
James E. Tillman
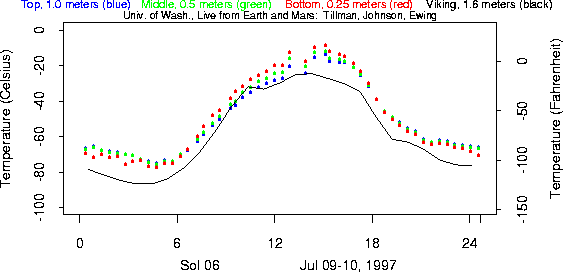
Atmospheric temperatures are the featured Pathfinder meteorological observations and the temperatures encountered at the surface of Earth and Mars provide the primary basis for these developments. The temperatures on the two Viking landers, measured at 1.5 meters above the surface, range from + 1° F, ( -17.2° C) to -178° F (-107° C). However, the temperature of the surface at the winter polar caps drop to -225° F, (-143° C) while the warmest soil occasionally reaches +81° F (27° C) as estimated from Viking Orbiter Infrared Thermal Mapper. The diurnal cycle of atmospheric temperature is as important meteorologically as it is on Earth, but it is less important in other contexts: the reason will become evident in the lessons that follow. The diurnal temperature variation at Viking Lander 1 at the same season as Pathfinder is landing is illustrated here and described below.
( plotted and tabulated data )
Temperature, an important daily factor in our lives, is featured in these developments due to the wide ranging applicability of the underlying science concepts. It is a particularly rewarding study topic, since it is relatively easy to measure, and students can compare their observations with each other, with past and present Earth and Mars observations, and with the results from Pathfinder on a day by day basis. Although atmospheric temperature is determined by many factors, the daily cycles of solar heating is easy to grasp by first graders. Our goal, with our collaborating teachers, is for primary students to understand not only the solar heating, but Infrared cooling, since the balance between radiation, conduction and convection, controls temperature on scales ranging from those of insects to humans to planets. Deeper investigations of topics, such as cloudiness, wind chill, insulation, soil properties, evaporation and condensation, expands students knowledge, and opens the door to the study of a multitude of topics.
Although the atmosphere of Mars is 100 times thinner than that of Earth, and it doesn't have any liquid water, it is similar to ours in many aspects. Mars is only other planet in our solar system where surface based meteorological stations can survive. The other planets are too hot, (Venus), have no atmosphere, (Mercury), or have deep, gaseous atmospheres. It also is the only other planet where humans can live. To understand the Martian diurnal, seasonal and annual temperature cycle, first consider the above plot of several sols of Viking Landers 1, (Murphy et al., 1990. ), & 2 (Tillman et al., 1983 ) data during northern hemisphere summer, the same time of year as the Pathfinder landing. These begin on VL1 sol 95, Ls = 142°, ( Lsrepresents the Solar Longitude, or the season, where Ls = 90° is summer, 180° is autumnal equinox, 270° is winter, and 360° or 0°, is spring). The first obvious difference between Earth and Mars is that the sub tropics of Mars is far colder: this is mainly due Mars being further from the sun than Earth. At VL1, 22° N, the afternoon, maximum, summer temperatures reaching a peak of only -12° F, (-25° C). The minimum temperature is -128° F, (-89° C), just prior to sunrise: this is the sub-tropics, during summer! The diurnal cycle is similar to that of Earth on a clear day except for the much greater Martian temperature variation of 113 ° F, (63 ° C). Plotted and tabulated data permit the comparison of VL1 with VL2, and at VL2, 48° N, the minimum is similar but the maximum is 18 to 27° F, (10 to 15° C) colder.
Revised: Due to the low density of the Martian atmosphere, the temperature of the surface is controlled primarily by solar heating, and infrared cooling to the atmosphere and space, rather than heat exchange with the atmosphere. The lower few kilometers of the atmosphere during the day, and the lower tens to hundreds of meters during night, are in turn controlled by heat exchange with the surface, and by absorption of infrared radiation from the sun and surface and re radiation to the surface, space and rest of the atmosphere. For the same conditions, (wind speed, clear sky, etc.), the denser atmosphere of Earth near the surface exchanges more heat with the surface, than does the thinner Martian atmosphere. i.e, Earth's atmosphere has more influence on the surface temperature than does the Martian atmosphere. One might speculate what the diurnal temperature range of an object on the Martian surface might be if it had a thick atmosphere like Venus, (without its cloud cover), or an almost non existent atmosphere like our Moon which has only has a few molecules whizzing around like projectiles on ballistic trajectories.
Now that we have established the diurnal temperature behavior at the VL1 site, nearby in latitude and longitude, lets take a look at the pathfinder temperature for the sol at the same season from a frame extracted from the Pathfinder page.

The single Viking temperature sensor (black line) in the above plot, which includes Pathfinder Sol 6 data, is located about 1.5 meters above the ground. Pathfinders three sensors are located at 0.25 meter (red), 0.5 meter (green) and 1.0 (blue) meter above the petal, which itself is close to a half meter above the surface on the air bags. These data consist of about three minute averages approximately every 30 minutes throughout the 24.66 hour Martian day. (I chose those colors to represent human associations during daytime, since the sensor closest to the surface is hottest.) Just like on Earth for clear skies and with no front (different air mass) moving in, the vertical temperature gradient reverses at night, with the surface now cooler. Note that with the exception of early morning, the pathfinder temperatures are about 10° C hotter than Viking. This sol clearly shows the transition from stable nighttime (lower sensor cooler) to unstable daytime (upper sensor cooler) at 6 AM and the reverse transition at 18:00, (6 PM).

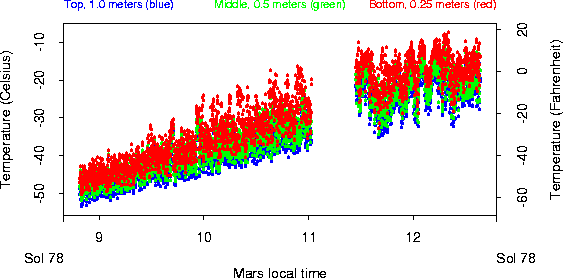
The above plot shows point by point temperature from sol 78 during which fast sampling at intervals of 1, 2 or 4 seconds was used and data were taken as continuously as permitted by spacecraft operations. During this sol, at the end of the mission, Pathfinder was operating on solar panels only. In the early morning, the fluctuations were on the order of 10° C and slowly, uniformly increasing. By 10 AM, larger warm bursts of an additional 10° C can be seen, and by 11:30, the overall variability of the minimum temperature at the top, as well as the bottom of the mast increased. Note, the largest variations are on the order of 20° C in apparently several minutes or less.
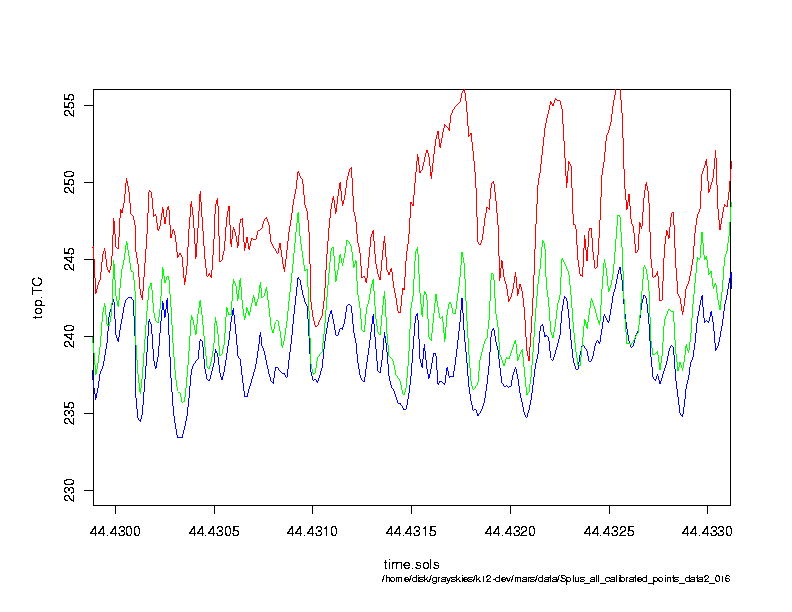
The temperature plot below shows a 266 second segment at 10:18 AM on
sol 44. (The time is given in decimal sols, for the 24.66 hour Mars
day.) Note that the temperature at the different levels can be clearly
distinguished, and the top sensor (blue) is almost invariably cooler
than the middle (green) which in turn is generally much cooler than
the bottom (red) sensor. Also evident is the fact that the large
features at the bottom sensor are mostly reproduced in the top one,
along with some of the smaller features.

The sharp temperature drop at 44.4310 hours occurrs at the rate of 20° C in 8 seconds. The rapidity of the fluctuations is due to the small size of the sensors, which are 0.003 inch, or 75 micro-meter diameter "thermocouple" wires. (Thermocouples mesure temperature by joining two different materials to produce a voltage dependent on the temperature.) Numeric data for some of the average observations are available for comparison with other Mars and Earth data and the point by point data from Pathfinder and Viking will be provided and incorporated as these resources are developed in the future.
To obtain seasonal variations, we return to Viking where as we proceed toward autumnal equinox, Ls = 180°, the average temperature at VL1 remains relatively constant while that at VL2 decreases and becomes more variable from sol to sol as the weather "fronts" begin to increase in the northern hemisphere. Segment 2, beginning at VL1 sol 200,
shows about 20 sols at VL1 and 2, Ls = 202°. Note that for the first 10 sols, VL1 temperatures are similar to earlier while VL2 has cooled markedly. VL2 temperatures vary significantly from sol to sol, roughly repeating every 2 to 3 sols due to the weather "fronts". Note that the maximum VL2 temperature (blue) on sol 200 is higher than on 201 which is higher than on 202 which is lower than on 203, and the cycle closely repeats a couple of times up until sol 208. Beginning on sol 210, the VL1 temperature decreases rapidly as does VL2: this is due to the 1977 A dust storm mentioned before. Although not covered here, the low VL2 sol 161 temperature (corresponding to VL1 sol 205), was caused by strong winds from the north blowing clouds, often observed around the north polar region, south over VL2 around noon, Tillman, et al., 1979.
The last period described here, covers the period immediately preceding, during the buildup, and a bit of the decay of the 1977 B, great dust storm. By the beginning, VL1 sol 305, Ls = 269° (winter begins at Ls = 270°), the temperature and diurnal range have both decreased markedly compared to Segment 2. The VL1 temperature is fairly constant and repetitive until about sol 313 when its diurnal variation and average temperature decrease more rapidly than before. The pressure plot shows the slow buildup and long decay of this very intense dust storm in the top frame of the plot beginning at Ls = 270°.
Atmospheric dust causes daily pressure variations, proportional to the dust amount; the magnitude of the daily variation can increase rapidly, but decreases slowly as the dust falls out of the atmosphere if its a deep, great dust storm. "Great" dust storms, such as the 1977 A and 1977 B storm, produce large increases in the daily pressure and decreases in atmospheric temperature variations, which then slowly recover over many tens of sols. During these dust storms, the maximum daytime temperature decreases and the minimum, nighttime temperature increases: the effect is very similar to that of clouds on Earth and details will be presented in future enhancements. The effect of the Martian dust storms provided some of the impetus for the study of the "Nuclear Winter" concept in the TTAPS paper, authored by Turco, Toon, Ackerman, Pollack and Sagan: the latter two were Viking Science Team members.
A suite of exercises comparing the pressure, temperature and wind, during equivalent dust storm seasons in the first and second years, is planned for future exercise and material development.
Unless otherwise specified, Mars images are courtesy of NASA JPL or
Hubble.
The assistance of George LeCompte and Neal Johnson gratefully is
acknowledged.
