A common application in many scientific disciplines involves
plotting one or several time-series as as ``wiggles'' along
tracks. Marine geophysicists often display magnetic anomalies
in this manner, and seismologists use the technique when
plotting individual seismic traces. In our example we will
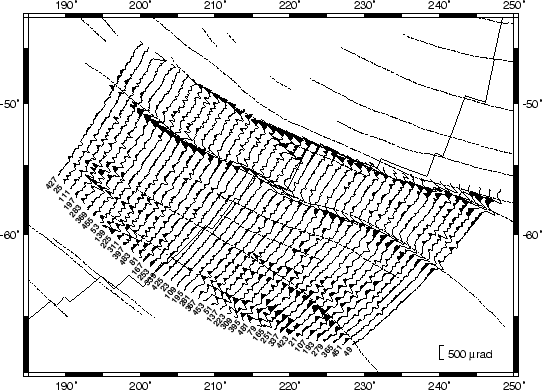
show how a set of Geosat sea surface slope profiles from the
south Pacific can be plotted as ``wiggles'' using the
pswiggle program. We will embellish the plot with track
numbers, the location of the Pacific-Antarctic Ridge, recognized
fracture zones in the area, and a ``wiggle'' scale. The
Geosat tracks are stored in the files *.xys, the ridge in
ridge.xy, and all the fracture zones are stored in the multiple
segment file fz.xy. We extract the profile id (which is the
first part of the file name for each profile) and the last point
in each of the track files to construct an input file for
pstext that will label each profile with the track
number. We know the profiles trend approximately N40![]() E
so we want the labels to have that same orientation (i.e., the
angle with the baseline must be 50
E
so we want the labels to have that same orientation (i.e., the
angle with the baseline must be 50![]() ). We do this by
extracting the last record from each track, paste this file
with the tracks.lis file, and use $AWK to create the
format needed for pstext. Note we offset the positions
by -0.05 inch with -D in order to have a small gap
between the profile and the label:
). We do this by
extracting the last record from each track, paste this file
with the tracks.lis file, and use $AWK to create the
format needed for pstext. Note we offset the positions
by -0.05 inch with -D in order to have a small gap
between the profile and the label:
#!/bin/csh
#        GMT EXAMPLE 09
#
#        $Id: job09.csh,v 1.5 2004/04/10 17:19:14 pwessel Exp $
#
# Purpose:    Make wiggle plot along track from geoid deflections
# GMT progs:    pswiggle, pstext, psxy
# Unix progs:    $AWK, ls, paste, tail, rm
#
pswiggle track_*.xys -R185/250/-68/-42 -U"Example 9 in Cookbook" -K -Jm0.13i -Ba10f5 -Gblack -Z2000 \
   -W0.25p -S240/-67/500/@~m@~rad >! example_09.ps
psxy -R -J -O -K ridge.xy -W1.25p >> example_09.ps
psxy -R -J -O -K -M fz.xy -W0.5pta >> example_09.ps
if (-e tmp) then
    \rm -f tmp
endif
foreach file (track_*.xys)    # Make label file
    tail -1 $file >> tmp
end
ls -1 track_*.xys | $AWK -F. '{print $2}' >! tracks.lis
paste tmp tracks.lis | $AWK '{print $1, $2, 10, 50, 1, "RM", $4}' | pstext -R -J -D-0.05i/-0.05i -O \
   >> example_09.ps
\rm -f tmp tracks.lis .gmt*
The output shows the sea-surface slopes along 42 descending Geosat tracks in the Eltanin and Udintsev fracture zone region in a Mercator projection (Figure 7.9).