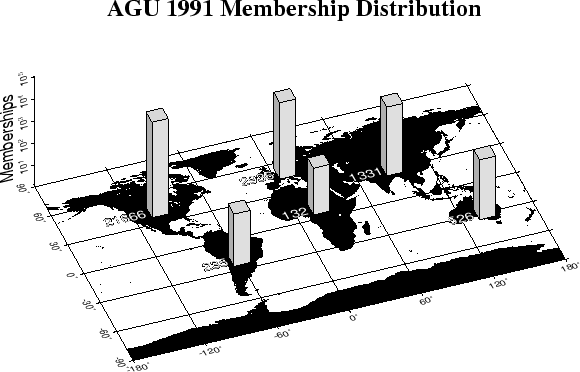
Our next and perhaps silliest example presents a
three-dimensional bargraph plot showing the geographic
distribution of the membership in the American Geophysical
Union (AGU). The input data was taken from the 1991 AGU
member directory and added up to give total members per
continent. We decide to plot a 3-D column centered on
each continent with a height that is proportional to the
logarithm of the membership. A log![]() -scale is
used since the memberships vary by almost 3 orders of
magnitude. We choose a plain linear projection for the
basemap and add the columns and text on top. Our script reads:
-scale is
used since the memberships vary by almost 3 orders of
magnitude. We choose a plain linear projection for the
basemap and add the columns and text on top. Our script reads:
#!/bin/csh
#        GMT EXAMPLE 10
#
#        $Id: job10.csh,v 1.8 2004/08/17 02:30:32 pwessel Exp $
#
# Purpose:    Make 3-D bar graph on top of perspective map
# GMT progs:    pscoast, pstext, psxyz
# Unix progs:    $AWK, rm
#
pscoast -Rd -JX8id/5id -Dc -Gblack -E200/40 -K -U"Example 10 in Cookbook" \
   >! example_10.ps
psxyz agu.d -R-180/180/-90/90/1/100000 -J -JZ2.5il -So0.3ib1 -Ggray -W0.5p -O -K -E200/40 \
   -B60g60/30g30/a1p:Memberships:WSneZ >> example_10.ps
$AWK '{print $1-10, $2, 20, 0, 0, "RM", $3}' agu.d | pstext -Rd -J -O -K -E200/40 \
   -Gwhite -S0.5p >> example_10.ps
echo "4.5 6 30 0 5 BC AGU 1991 Membership Distribution" | pstext -R0/11/0/8.5 -Jx1i -O \
   >> example_10.ps
\rm -f .gmt*
The result is presented in Figure 7.10.