 |
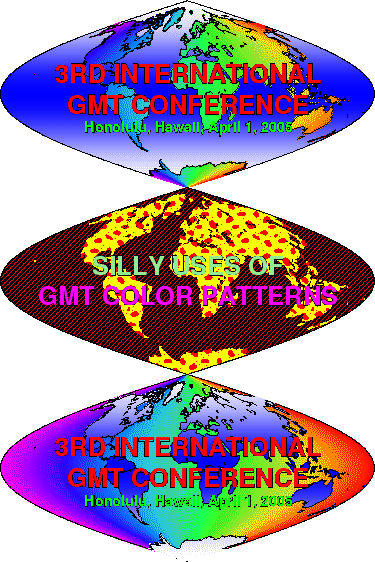
GMT 3.1 introduced color patterns and this examples give a few cases of how to use this new feature. We make a phony poster that advertises an international conference on GMT in Honolulu. We use grdmath, makecpt, and grdimage to draw pleasing color backgrounds on maps, and overlay pscoast clippaths to have the patterns change at the coastlines. The middle panel demonstrates a simple pscoast call where the built-in pattern # 86 is drawn at 100 dpi but with the black and white pixels replaced with color combinations. The final panel repeats the top panel except that the land and sea images have changed places (Figure 7.19).
#!/bin/csh
#        GMT EXAMPLE 19
#
#        $Id: job19.csh,v 1.7 2004/06/10 17:45:32 pwessel Exp $
#
# Purpose:    Illustrates various color pattern effects for maps
# GMT progs:    gmtset, grdimage, grdmath, makecpt, pscoast, pstext
# Unix progs:    rm
#
# First make a worldmap with graded blue oceans and rainbow continents

gmtset COLOR_MODEL rgb
grdmath -Rd -I1 -F Y COSD 2 POW = lat.grd
grdmath -Rd -I1 -F X = lon.grd
echo "0 255 255 255 1 0 0 255" >! lat.cpt
makecpt -Crainbow -T-180/180/60 -Z >! lon.cpt
grdimage lat.grd -JI0/6.5i -Clat.cpt -P -K -Y7.5i -B0 >! example_19.ps
pscoast -R -J -O -K -Dc -A5000 -Gc >> example_19.ps
grdimage lon.grd -J -Clon.cpt -O -K >> example_19.ps
pscoast -R -J -O -K -Q >> example_19.ps
pscoast -R -J -O -K -Dc -A5000 -W0.25p >> example_19.ps
echo "0 20 32 0 1 CM 3RD INTERNATIONAL" | pstext -R -J -O -K -Gred -S0.5p >> example_19.ps
echo "0 -10 32 0 1 CM GMT CONFERENCE" | pstext -R -J -O -K -Gred -S0.5p >> example_19.ps
echo "0 -30 18 0 1 CM Honolulu, Hawaii, April 1, 2005" | pstext -R -J -O -K -Ggreen -S0.25p \
   >> example_19.ps

# Then show example of color patterns

pscoast -R -J -O -K -Dc -A5000 -Gp100/86:FredByellow -Sp100/7:FredBblack -B0 -Y-3.25i \
   >> example_19.ps
echo "0 15 32 0 1 CM SILLY USES OF" | pstext -R -J -O -K -Glightgreen -S0.5p >> example_19.ps
echo "0 -15 32 0 1 CM GMT COLOR PATTERNS" | pstext -R -J -O -K -Gmagenta -S0.5p >> example_19.ps

# Finally repeat 1st plot but exchange the patterns

grdimage lon.grd -J -Clon.cpt -O -K -Y-3.25i -B0 -U"Example 19 in Cookbook" >> example_19.ps
pscoast -R -J -O -K -Dc -A5000 -Gc >> example_19.ps
grdimage lat.grd -J -Clat.cpt -O -K >> example_19.ps
pscoast -R -J -O -K -Q >> example_19.ps
pscoast -R -J -O -K -Dc -A5000 -W0.25p >> example_19.ps
echo "0 20 32 0 1 CM 3RD INTERNATIONAL" | pstext -R -J -O -K -Gred -S0.5p >> example_19.ps
echo "0 -10 32 0 1 CM GMT CONFERENCE" | pstext -R -J -O -K -Gred -S0.5p >> example_19.ps
echo "0 -30 18 0 1 CM Honolulu, Hawaii, April 1, 2005" | pstext -R -J -O -Ggreen -S0.25p \
   >> example_19.ps

\rm -f l*.grd l*.cpt .gmt*